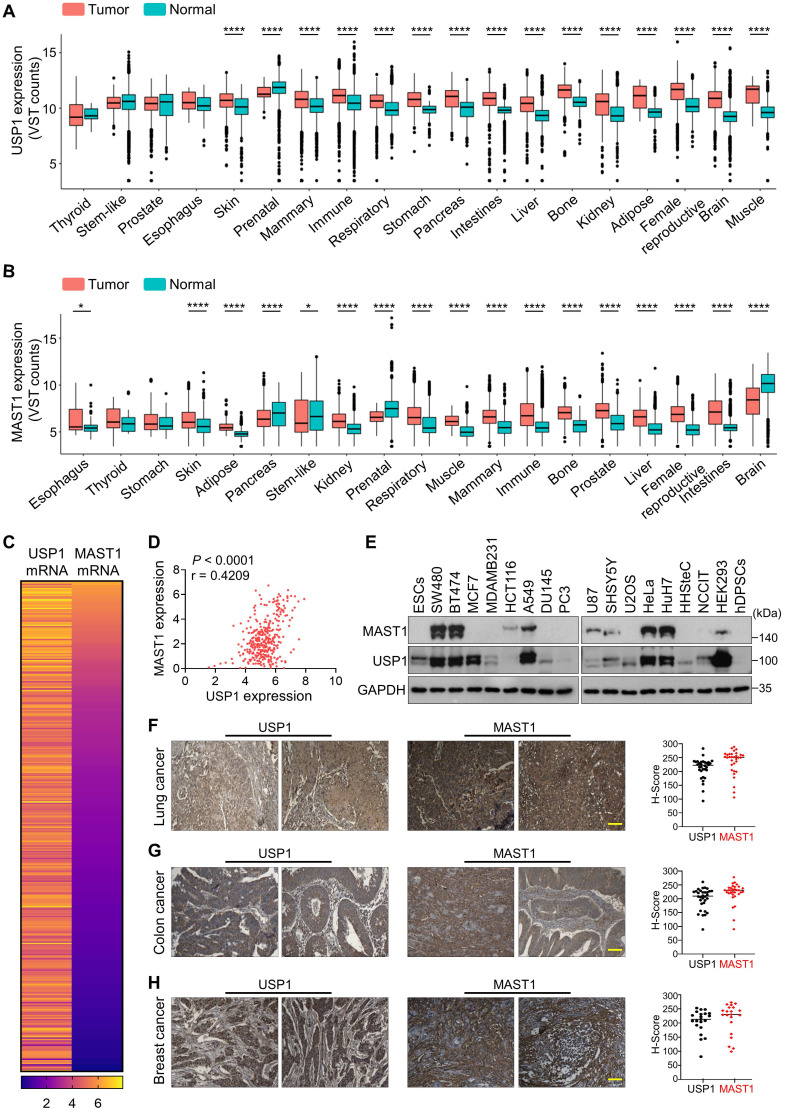
Figure 6.
Clinical correlation between USP1 and MAST1 expression in various cancer tissues. (A) Box plot showing the difference between USP1 expression in tumor and normal tissues using Correlation AnalyzeR. Significance was determined via the Wilcoxon rank sum test: ****P < 0.0001. (B) Box plot showing the difference between MAST1 expression in tumor and normal tissues using Correlation AnalyzeR. Significance was determined via the Wilcoxon rank sum test: *P < .05, ****P < 0.0001. VST stands for variance-stabilizing transform. (C) A heat map showing mRNA expression levels of USP1 and MAST1 derived from the CCLE database. Representative samples are arranged from high to low mRNA levels of MAST1, and corresponding USP1 values are sorted. (D) A scatterplot showing the expression correlation between USP1 and MAST1 mRNA levels. Pearson correlations (r) quantifying the relationship between USP1 and MAST1 are given. (E) Endogenous protein expression patterns of USP1 and MAST1 in different cancer and non-cancer cell lines were assessed by Western blotting. GAPDH was used as the loading control. (F-H) Representative immunohistochemical (IHC) staining images of endogenous USP1 and MAST1 in (F) human lung cancer (n = 32), (G) colon cancer (n = 32), and (H) breast cancer (n = 21) tissues. All IHC images were quantified with an H-score. Scale bar = 30 µm.

