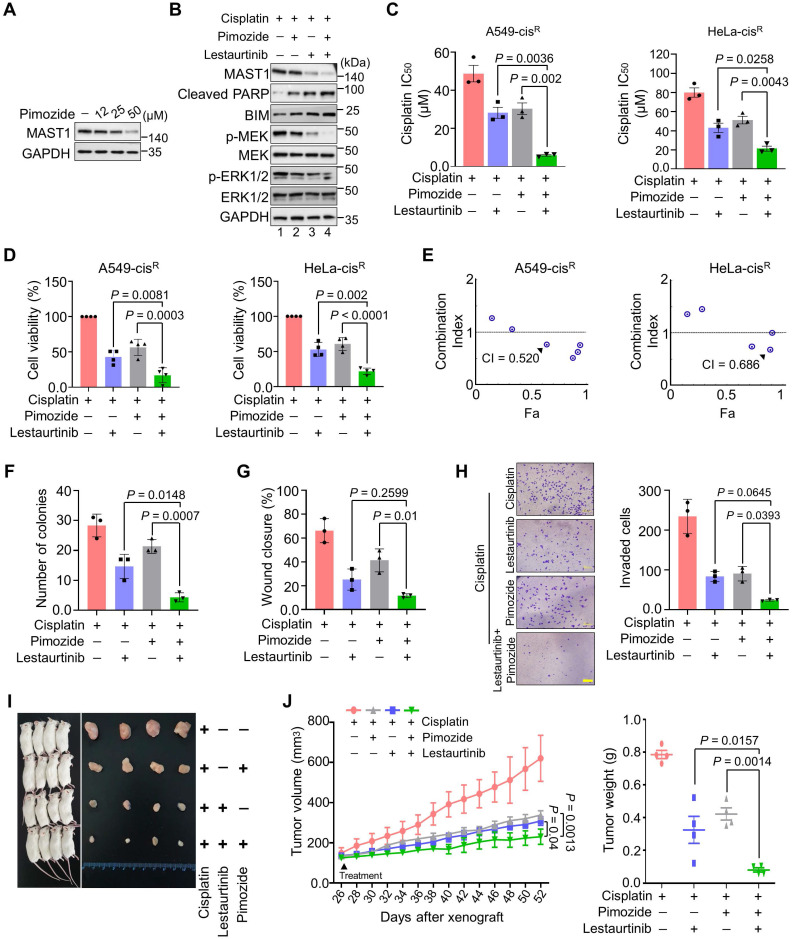
Figure 8.
Combination of pimozide and lestaurtinib inhibits MAST1 protein and cisplatin-resistant tumor growth more than either single treatment. (A) The effect of USP1 inhibition on MAST1 protein level was determined by treating HeLa-cisR cells with increasing concentrations of pimozide for 24 h. The protein expression of MAST1 was determined by Western blotting. GAPDH was used as an internal loading control. (B) The effect of combination treatment of pimozide and lestaurtinib on MAST1-mediated MEK phosphorylation. HeLa-cisR cells were treated with pimozide (50 µM) and lestaurtinib (200 nM) in the presence of sub-lethal doses of cisplatin (5 µg/mL) for 24 h. The activity of MAST1 was assessed by a Western blot analysis of the phospho-MEK1 and phospho-ERK levels. GAPDH was used as an internal loading control. (C, D) The effect of combined treatment with pimozide and lestaurtinib on (C) cisplatin sensitivity (n = 3) (D) and cell viability in A549-cisR and HeLa-cisR cells (n = 4). Data are presented as the mean and standard deviation of at least three independent experiments. Two-way ANOVA followed by Tukey's post hoc test was used with the indicated P values. (E) Combination index (CI) plots for the synergistic effect of pimozide and lestaurtinib in A549-cisR and HeLa-cisR cells. (F-H) The effect of combination treatment with pimozide and lestaurtinib was validated using (F) colony formation assay, (G) wound-healing assay, and (H) Transwell cell-invasion assay. Data are presented as the mean and standard deviation of three independent experiments (n = 3). Two-way ANOVA followed by Tukey's post hoc test was used with the indicated P values. (I) Xenografts were generated by subcutaneously injecting A549-cisR cells into the right flanks of NSG mice (n = 4). Mice were treated with pimozide (10 mg/kg), lestaurtinib (20 mg/kg), and cisplatin (5 mg/kg) beginning 26 days after xenograft implantation, and tumor size was monitored. The right panel shows the tumors excised from the mice after the experiment. (J) Tumor volume and tumor weight were measured and are presented graphically. Data are presented as the mean and standard deviation of four independent experiments (n = 4). Two-way ANOVA followed by Tukey's post hoc test was used with the indicated P values. For brevity, statistical significance is shown only for comparisons between the groups of interest, except for the negative control group.

