Figure 3.
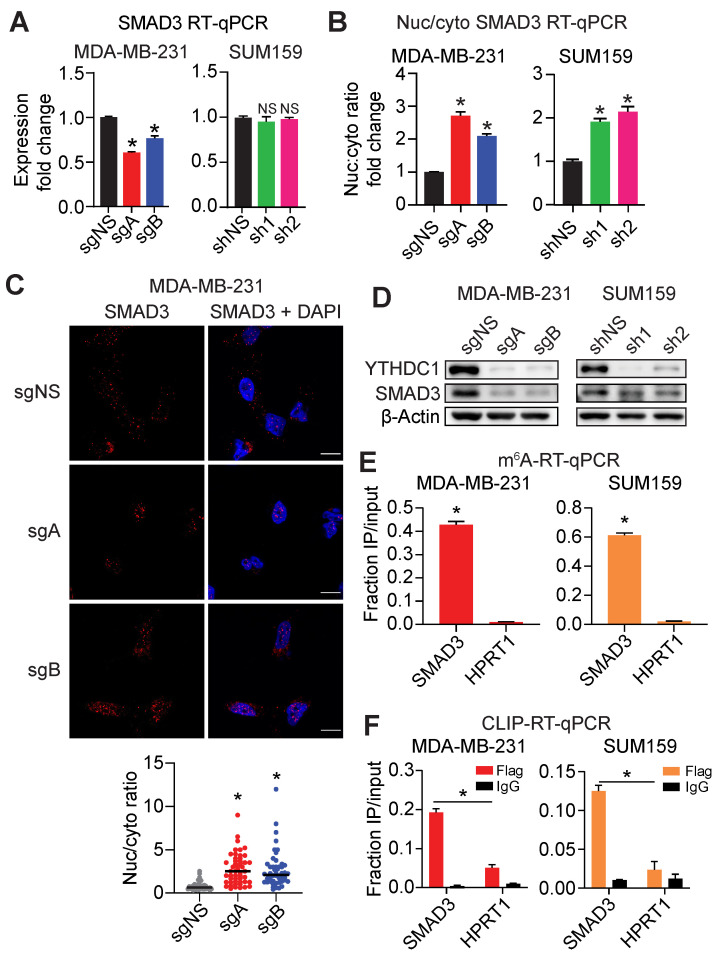
YTHDC1 promotes SMAD3 mRNA nuclear export in TNBC cells. A) SMAD3 transcript levels quantified by RT-qPCR in MDA-MB-231 YTHDC1 KO or SUM159 YTHDC1 KD cells. One-way ANOVA compared to control. B) Changes in the nuclear to cytoplasmic ratio of SMAD3 mRNA in MDA-MB-231 YTHDC1 KO or SUM159 YTHDC1 KD cells quantified by RT-qPCR. One-way ANOVA compared to control. C) Representative images and quantification of SMAD3 mRNA localization by FISH following YTHDC1 KO in MDA-MB-231 cells. Scale bar: 10 μm. Each point on the graph represents a single cell. One-way ANOVA compared to sgNS. n = 50/group. D) Western Blots of SMAD3 in MDA-MB-231 YTHDC1 KO or SUM159 YTHDC1 KD cells. E) m6A-RT-qPCR for SMAD3 in MDA-MB-231 and SUM159 cells. HPRT1 was used as a non-target control. One-way ANOVA compared to HPRT1. F) CLIP-RT-qPCR for SMAD3 in MDA-MB-231 and SUM159 cells. HPRT1 was used as a non-target control. One-way ANOVA compared to flag-immunoprecipitated HPRT1. RT-qPCR data are presented as the mean ± SD; n = 3/group, NS = not significant, *P < 0.05.

