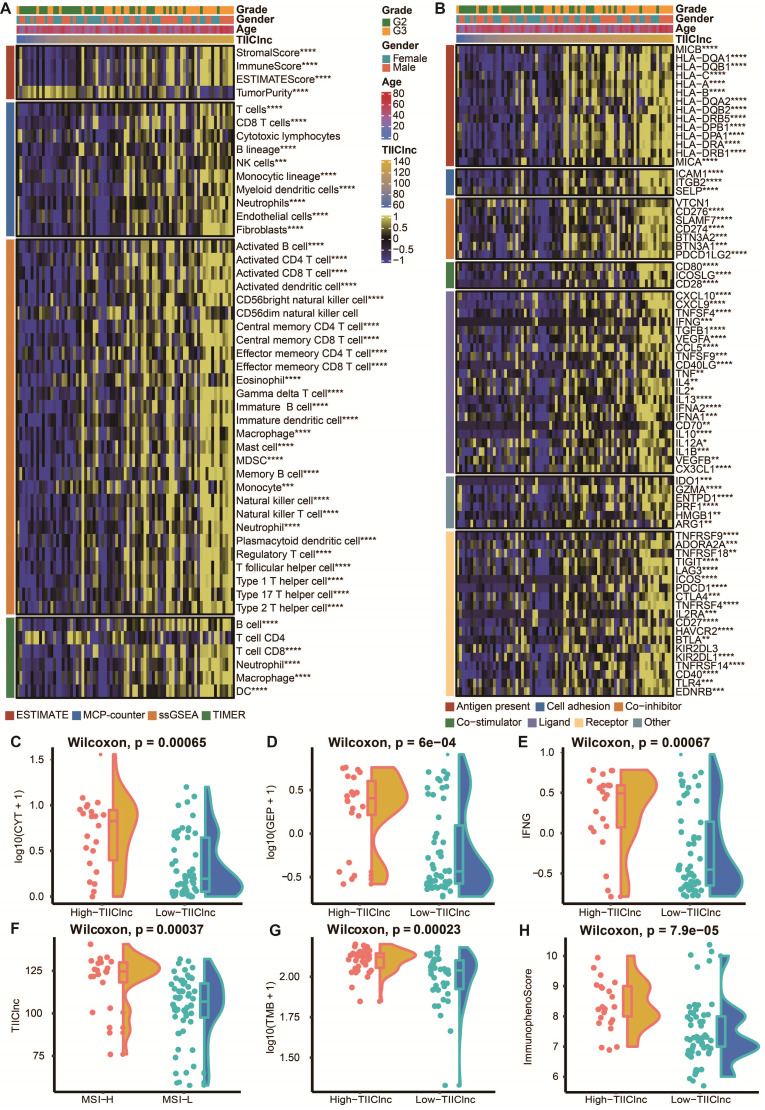
Figure 4.
Immune-related characteristics of the TIIClnc signature in the Xiangya in-house dataset. A. Heatmap displaying the correlation between the TIIClnc signature and immune infiltrating cells. B. Heatmap displaying the correlation between the TIIClnc signature and immune modulator molecules. C. Box plot displaying the CYT levels between two TIIClnc signature score groups. D. Box plot displaying the GEP levels between two TIIClnc signature score groups. E. Box plot displaying the IFN-γ levels between two TIIClnc signature score groups. F. Box plot displaying the TIIClnc levels between two MSI groups. G. Box plot displaying the TMB levels between two TIIClnc signature score groups. H. Box plot displaying the IPS levels between two TIIClnc signature score groups.

