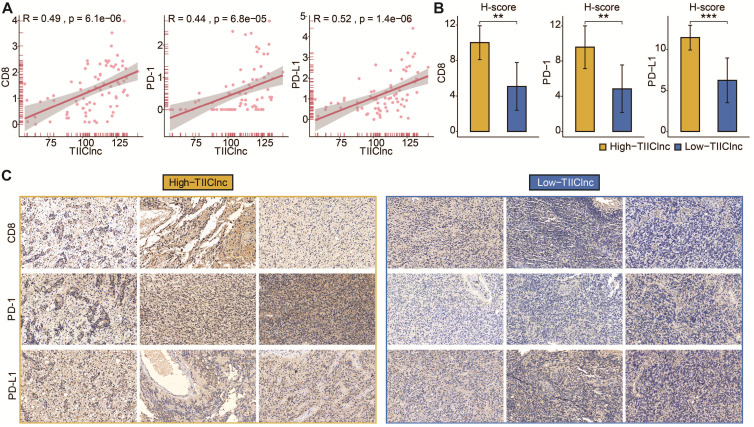
Figure 6.
A. Scatter plot displaying the correlation between the TIIClnc signature score and CD8, PD-1, and PD-L1 in the Xiangya in-house dataset. B. Box plot displaying the H-score levels of CD8, PD-1, and PD-L1 based on IHC staining between two TIIClnc signature score groups in the Xiangya in-house dataset. The H-score was calculated by intensity score * quantity score. As for intensity scores, 0, 1, 2, and 3 were considered negative, weak, moderate, and strong, respectively. As for quantity scores, 0, 1, 2, 3, and 4 represented <10%, 10-25%, 25-50%, 50-75%, >75% proportion of stained cells, respectively. H-score ranges from 0 to 12. C. Representative IHC staining images of CD8, PD-1, and PD-L1 in two TIIClnc signature score groups in the Xiangya in-house dataset.

