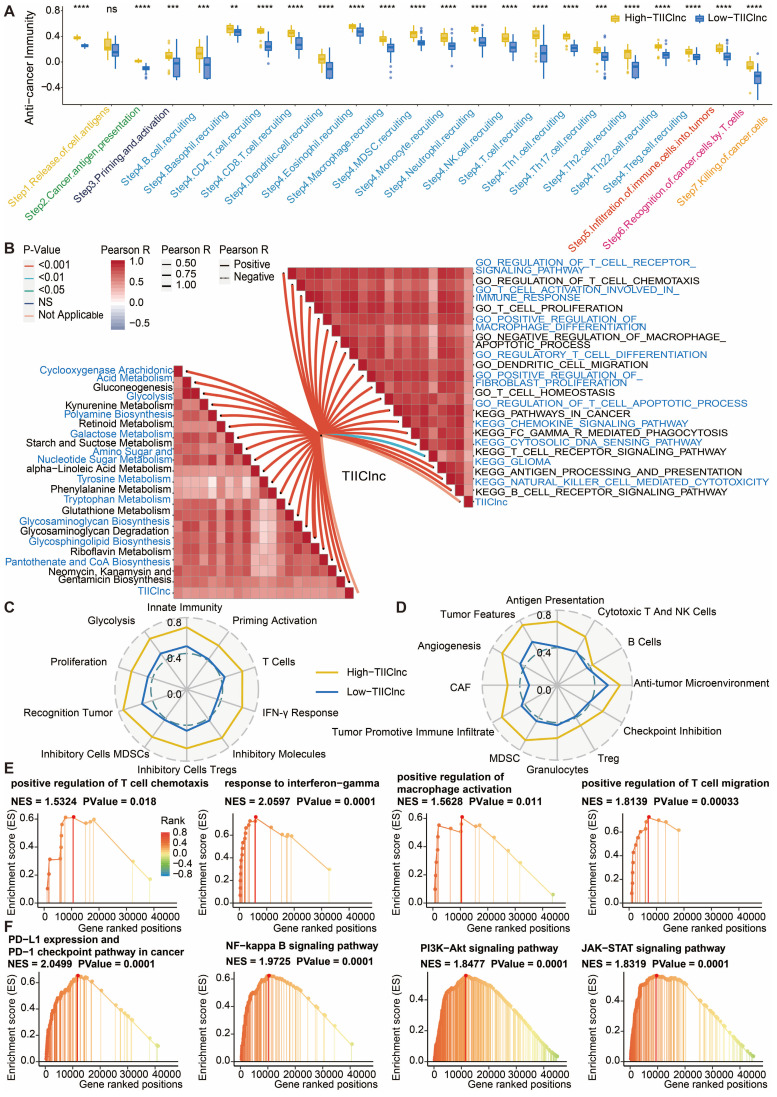
Figure 7.
Functional annotation of the TIIClnc signature in the Xiangya in-house dataset. A. Box plot displaying the cancer immunity cycle differences between two TIIClnc signature score groups. B. Butterfly plot displaying the correlation between the TIIClnc signature score and metabolic pathways, immune-related pathways based on GSVA of GO and KEGG terms. Immunogram radar plot displaying the correlation between the TIIClnc signature score and TIME signatures developed by C. Kobayashi and D. Bagaev. E. GSEA of GO terms for the TIIClnc signature score. F. GSEA of KEGG terms for the TIIClnc signature score.

