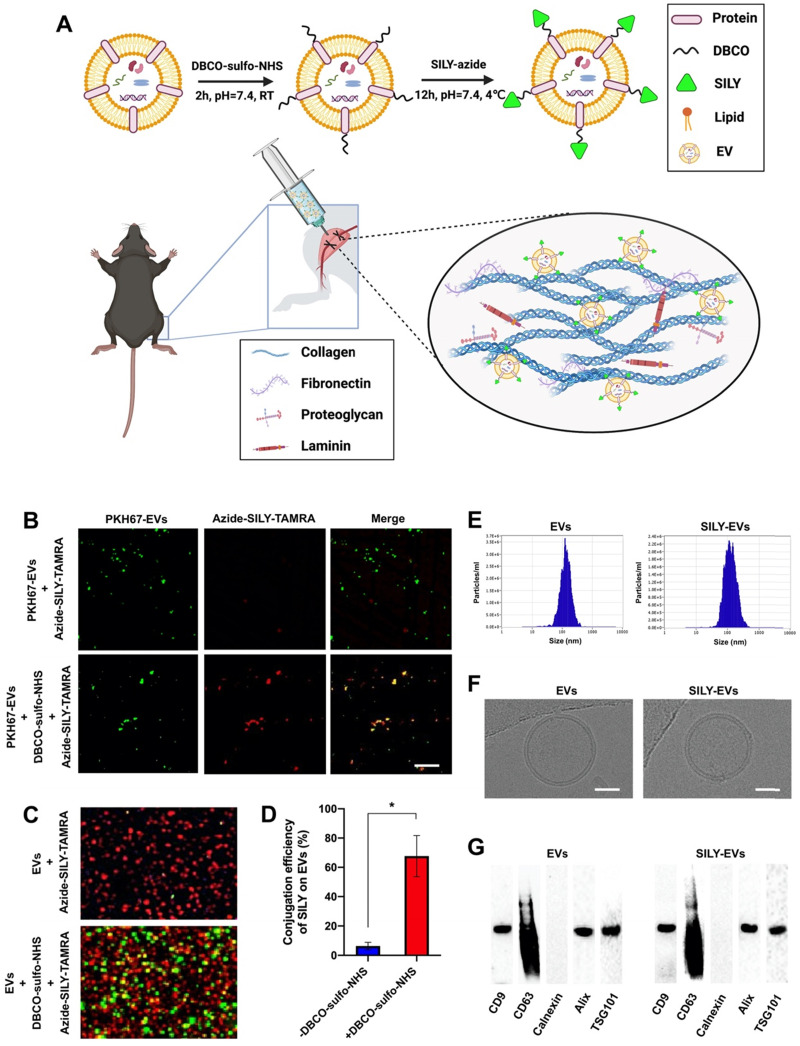
Figure 1.
Preparation and characterization of SILY-EVs. (A) Schematic diagram of the study design. (B) Evaluation of the SILY-EV conjugation process. Scale bar = 2 μm. (C) ExoView images of SILY-EV conjugation. Red indicated EVs stained with CD63. Green indicated SILY labeled with TAMRA. (D) Quantification of conjugation efficiency of SILY on EVs via ExoView. (E) Size distributions of EVs and SILY-EVs based on NTA measurements. (F) Cryo-EM images of EVs and SILY-EVs. Scale bar = 50 nm. (G) Western-blot analysis of EVs and SILY-EVs.

