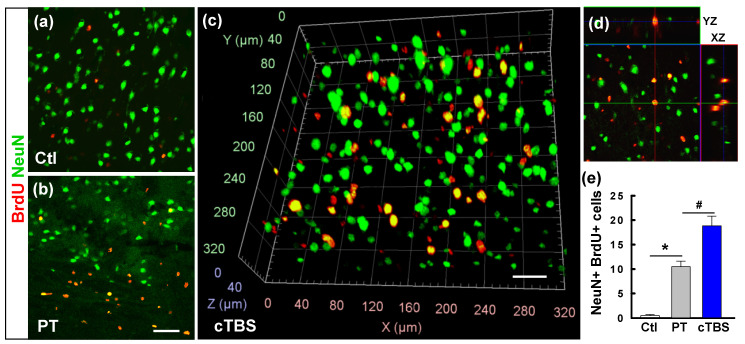
Figure 4.
cTBS enhanced the counts of newly generated neurons in the peri-infarct zone after PT stroke. (a-d) Representative confocal images in the peri-infarct area of Ctl and PT stroke animals at 22 d from the first BrdU injection. Typical NeuN and BrdU double-labeled cells in the cTBS group were viewed with the aid of arivis Vision4D software (c). Reconstructed orthogonal view of a BrdU (red) and NeuN (green) double-labeled cell, as shown in the y-z and x-z planes (right, d). The total numbers of newly generated neurons from the animals in each group were counted and plotted (e). Scale bars = 50 μm. Values indicate mean ± SE (N = 6-8). *P < 0.05 versus Ctl group, #P < 0.05 versus PT group.

