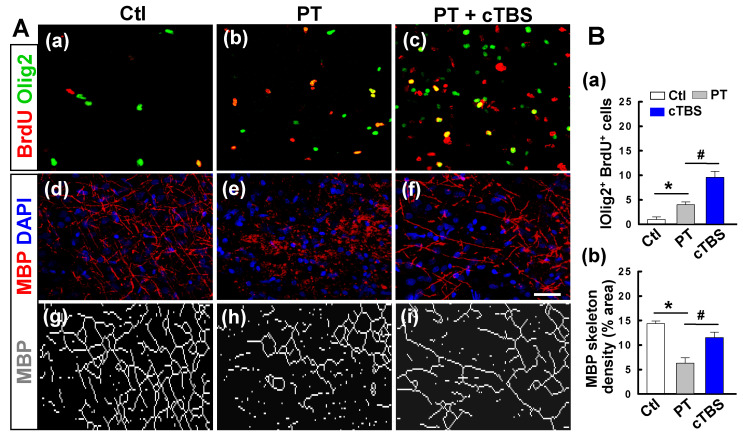
Figure 6.
cTBS treatment promoted oligodendrogenesis in the peri-infarct zone after PT stroke. A (a-c) Double immunostaining with anti-BrdU (red) and anti-Olig2 (green) antibodies to identify proliferating cells and oligodendrocytes in the peri-infarct zone at day 6. (d-i) Typical fluorescence images of MBP-immunoreactivity (red) with the DAPI nuclear counterstaining (blue) 22 days after PT stroke. The network dense of MBP-positive structures, which represents myelination of nerves, was skeletonized and presented for a better view (g-i). B (a, b) The levels of oligodendrogenesis and MBP skeleton density were quantified and indicated. Scale bars = 50 μm. Data are mean ± SE, N = 6-8. *P < 0.05 versus Ctl group, #P < 0.05 versus PT group.

