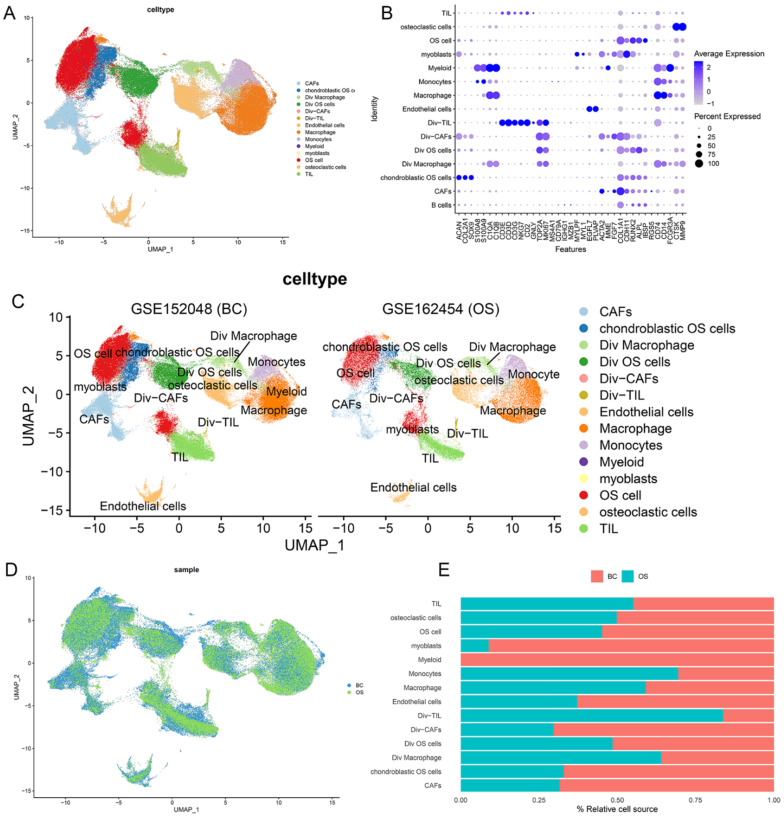
Figure 2.
Single-cell transcriptomic analysis of OS lesions. (A) The t-SNE plot of 14 identified cell types in OS lesions. (B) Dot plots of the 37 signature gene expressions in 14 cellular clusters (log1p transformed). (C, D) The t-SNE plots of the 14 cell types in GSE152048 (BC) and GSE162454 (OS). (E) Relative proportion of each cell cluster in GSE152048 (BC) and GSE162454 (OS) was indicated.

