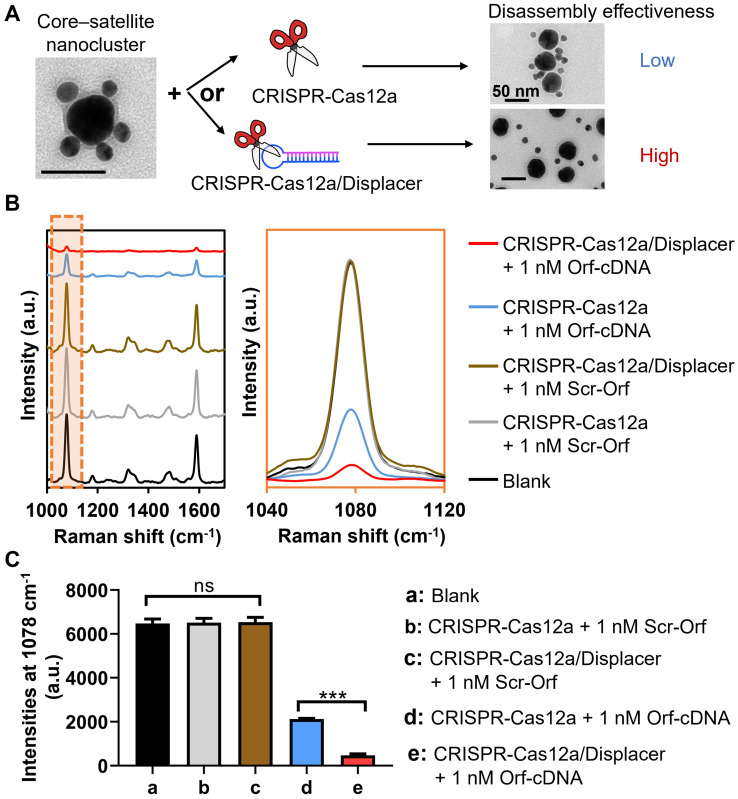
Figure 2.
Evaluation of detection performance of the biosensing system by the CRISPR-Cas12a-based method with (CRISPR-Cas12/Displacer) or without displacer (CRISPR-Cas12a) for detecting Orf-cDNA. (A) Illustration by representative TEM images of directly employing CRISPR-Cas12a (upper panel with low disassembly effectiveness) for disassembling core-satellite nanoclusters compared to using CRISPR-Cas12a-treated displacers (CRISPR-Cas12a/Displacer, lower panel with high disassembly effectiveness). The scale bar is 50 nm. (B) SERS spectra of biosensing platform after detecting blank samples, 1 nM Scr-Orf, and 1 nM Orf-cDNA. SERS spectra were zoomed into the region of 1040 to 1120 cm-1 to compare MBA-peak intensities between CRISPR-Cas12a group and CRISPR-Cas12a/Displacer group in the presence of Orf-cDNA at 1 nM. (C) MBA-peak intensities of the biosensing platform after detection of samples, corresponding to (B). Error bar denotes the standard deviation resulting from three independent experiments. Statistical analysis of pairwise comparison was determined by one-way ANOVA. No significance (ns): P > 0.05; *** P < 0.001.

