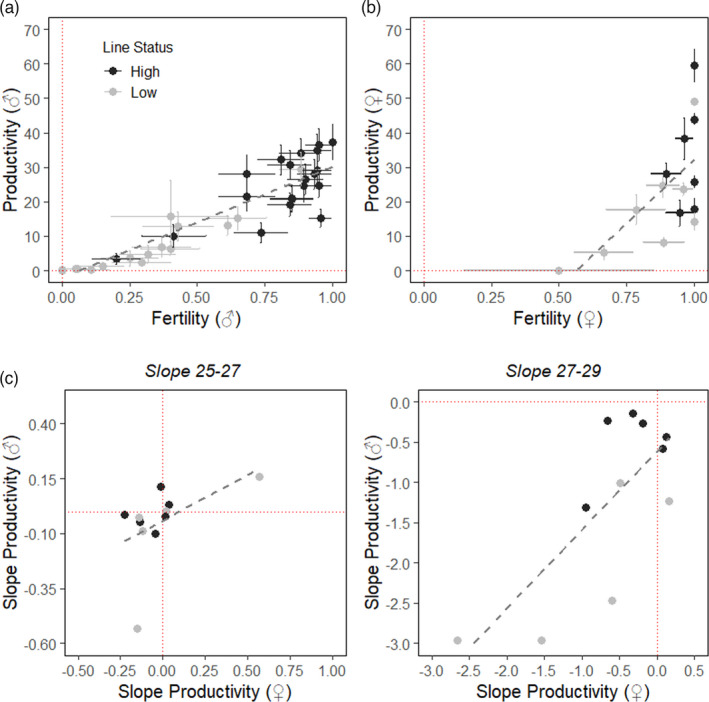
FIGURE 3.

Phenotypic correlations between fertility and productivity. (a) Phenotypic correlation between fertility and productivity in males; (b) Phenotypic correlation between fertility and productivity in females; (c) Phenotypic correlation between the productivity thermal reaction norms (i.e. slopes) of males and females; random slopes were extracted from random slope models modelling the relationship between productivity of either sex and the two lowest (25°C and 27°C), or the two highest (27°C and 29°C) temperatures. Different colours represent different line status (‘high lines’, dark grey, ‘low lines’ light grey), each dot represents an individual line. Grey dashed lines represent the linear relationship between variables. Red dotted lines mark the intercept = 0 of both variables represented
