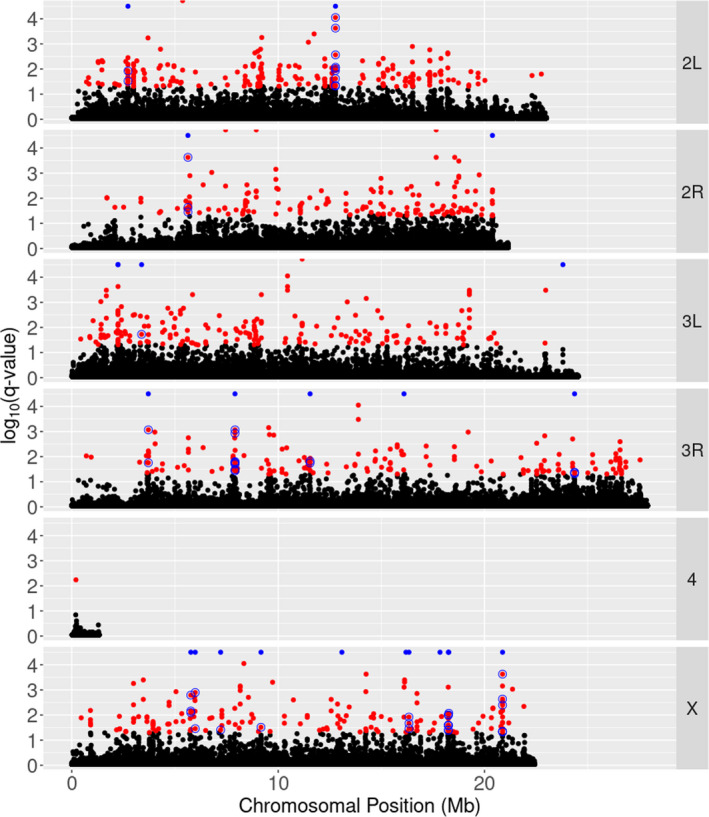
FIGURE 4.

A Manhattan plot showing the log10(q‐value) from BayeScan for all tested SNPs. SNPs shown in red have q‐values < 0.05. Blue points along the top of each panel denote the locations of 5 kb windows that are in the 99.9th percentile of the mean −log10(q‐value) distribution (candidate windows). Note that although there appear to be only 22, there are in fact 24 blue points. The first point from the left on 3 L, and second point from the right on the X, are both groups of two distinct points that appear as overlapping on this scale. Red points circled in blue are those SNPs that lie within a candidate window that also have a significant effect of line genotype on phenotype (productivity). The distribution of the number of SNPs in each 5 kb window and the mean −log10(q‐value) for each window across the genome are given in Figure S1
