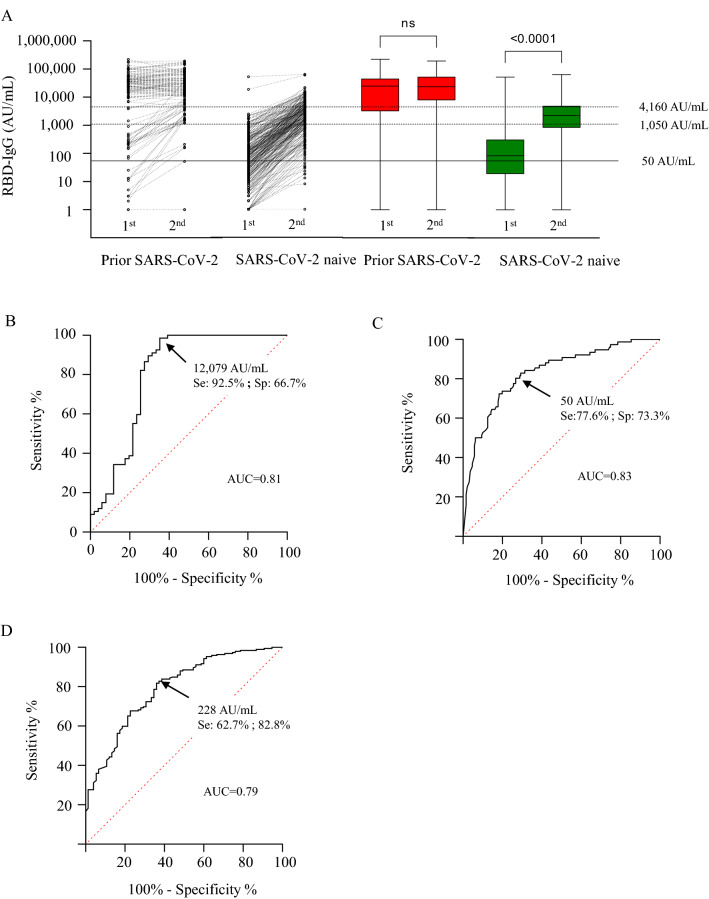
Figure 1.
RBD-IgG vaccine response after first and second doses. (A) Individual changes in RBD-IgG levels after first and second doses in NH residents with and without prior SARS-CoV-2 infection. RBD-IgG between first and second doses in NH residents with (red) and without (green) prior SARS-CoV-2 infection. (B) ROCs to evaluate RBD-IgG levels after the first dose, predictive of the lack of additional gain in RBD-IgG following the second dose in NH residents with prior SARS-CoV-2 infection; for a RBD-IgG level > 12,079 AU/mL: positive predictive value (PPV): 76.7%, negative predictive value (NPV): 54.5%, sensitivity: 92.5%; specificity: 66.7%. (C) ROC evaluating RBD-IgG levels after the first dose, predictive of the failure to reach a significant RBD-IgG level after the second dose (< 1050 AU/mL) in NH residents without prior SARS-CoV-2 infection; RBD-IgG < 50 AU/mL: PPV: 53.5%; NPV: 89.2%; sensitivity: 77.6%; specificity: 73.3%. (D) ROC to evaluate the RBD-IgG level after the first dose, predictive of a high RBD-IgG level following the second dose (≥ 4160 AU/mL) in NH residents without prior SARS-CoV-2 infection; RBD-IgG > 228 AU/mL: PPV: 58.8%; NPV: 85.0%; sensitivity: 82.8%; specificity: 62.7%.

