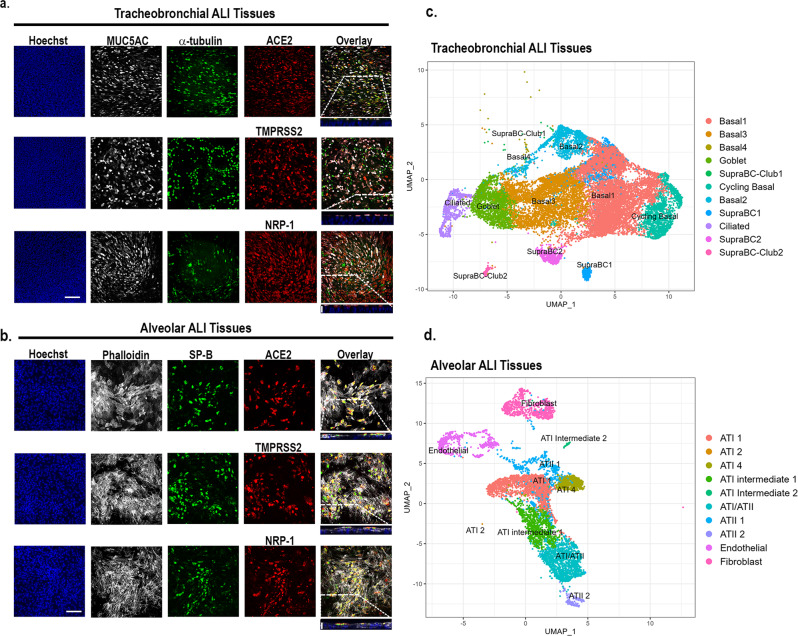
Fig. 1. Apical expression patterns of known SARS-CoV-2 entry co-factors in tracheobronchial and alveolar ALI tissue equivalents.
Post-day 21 tissues were stained with antibodies targeting ACE2, TMPRSS2, and NRP-1, as well as tissue-specific markers. a Representative stained images of tracheobronchial ALI tissues with Hoechst (nuclei marker, blue), MUC5AC (goblet cell marker, white) α -tubulin (ciliated cell marker, green), and ACE2 (top panel, red), TMPRSS2 (middle panel, red) or NRP-1 (bottom panel, red). The overlay image represents the maximum intensity projection of stained markers. The y/z plane cross section taken from the highlighted portion shows the selective apical expression of ACE2, TMPRSS2, and NRP-1. b Representative stained images of alveolar ALI tissues with Hoechst (nuclei marker, blue), phalloidin (f-actin, white), surfactant protein B (SP-B, ATII/pneumonocyte type II cell marker, green) and co-stained with ACE2 (top panel, red), TMPRSS2 (middle panel, red) or NRP-1 (bottom panel, red). The overlay image represents the maximum intensity projection of stained markers and a y/z plane cross section from the highlighted portion shows the selective apical expression of hACE2, TMPRSS2, or NRP-1 in the tissues, contrasted to phalloidin, which is present throughout the tissue cross-section. Scale bar is 100 μm. Cross-section scale bar is 20 μm. Uniform Manifold Approximation and Projection plots (UMAP plots) of scRNAseq data of dissociated (c) tracheobronchial or (d) alveolar ALI tissues.

