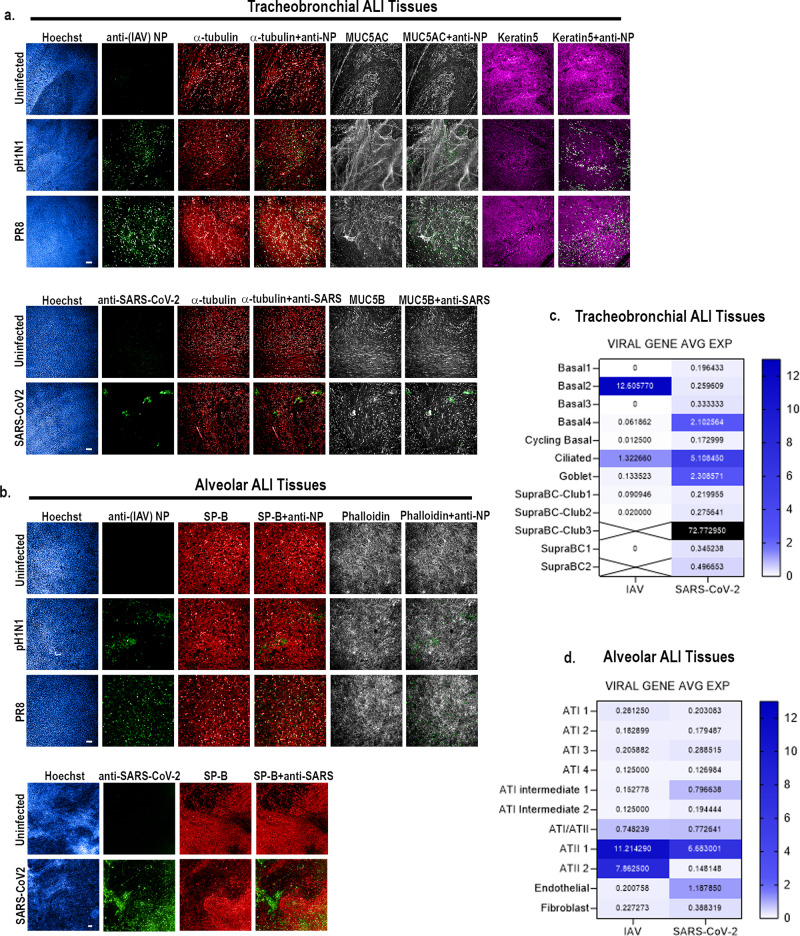
Fig. 2. IAV and SARS-CoV-2 productively infect tracheobronchial and alveolar ALI tissue equivalents.
Tracheobronchial and alveolar ALI tissues were infected with IAV strains pH1N1 or PR8 (1x10e5 TCID50 units), or SARS-CoV-2 (1x10e5 TCID50 units), (n = 3). Infected tissues were fixed at 24 hpi for IAV inoculated tissue, 36 hpi for SARS-CoV-2 inoculated tracheobronchial ALI tissue, or 144 hpi for SARS-CoV-2 inoculated alveolar ALI tissue and stained with antibodies against selected cell markers and virus antigens as indicated: a Tracheobronchial ALI tissues were stained with anti-(IAV) NP (green, top three panels) or anti-SARS-CoV-2 (monoclonal antibody cocktail targeting S and N proteins, green, bottom two panels), anti-α-tubulin (ciliated cell marker, red), anti-MUC5AC or MUC5B (goblet cell markers, white), and anti-keratin 5 (basal cell marker, magenta). b Alveolar tissues were stained with anti-(IAV) NP (green top three panels) or anti-SARS-CoV-2 (green, bottom two panels) as the marker of infected cells as well as anti-surfactant protein B (SP-B, ATII cell marker, red), phalloidin (F-actin, general cell marker, white). Scale bar is 100 μm and 200 μm in IAV and SARS-CoV-2 infected tissues, respectively. Viral gene expression levels, expressed as log transform mean expression, in identified cell subpopulation types within the human (c) tracheobronchial or (d) alveolar ALI tissues after 48 h of infection with PR8-IAV (left column), or after 72 h of infection with SARS-CoV-2 (right column). Identified viral genes per cell type were averaged and plotted as average log mean expression.

