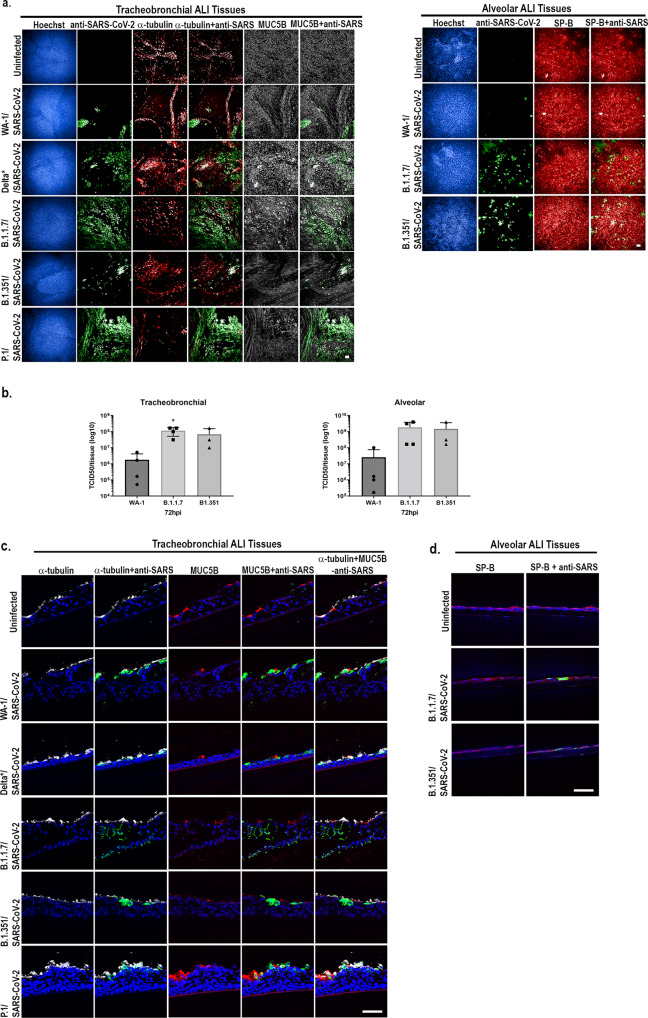
Fig. 4. Infection of alveolar and tracheobronchial ALI tissues with SARS-CoV-2 VoC exhibit enhanced infection.
Tracheobronchial and alveolar ALI tissues were infected with each SARS-CoV-2 VoC at 2×10⁵PFU/tissue. Apical washes were collected at 72, 96, and 144 hpi and tissues fixed at 72 hpi (tracheobronchial) or 96 hpi (alveolar). a Tracheobronchial and alveolar ALI tissues were stained with anti-SARS-CoV-2 to label infected cells (shown in green) as well as anti-tubulin (red) and anti-MUC5B (white), or anti-SP-B (red) and the nuclear dye Hoechst (blue). Scale bar is 100 μm. b Production of infectious virus from the apical chamber of tracheobronchial or alveolar ALI tissues after exposure to SARS-CoV-2 at 72 hpi. SARS-CoV-2 was measured using TCID50 assay on Vero-TMPRSS2 cells, and expressed as total TCID50/tissue. The 63x confocal images of cryosectioned (10 μm thickness) SARS-CoV-2 VoC infected tracheobronchial (c) or alveolar (d) tissue slices stained with anti-SARS-CoV-2 to label infected cells (shown in green) as well as (c) anti-tubulin (red) and anti-MUC5B (white), or (d) anti-SP-B (red) and the nuclear dye Hoechst (blue). Data are represented as M ± SD for a minimum of n = 3 independent experiments/biological replicates. Scale bar is 50 μm.

