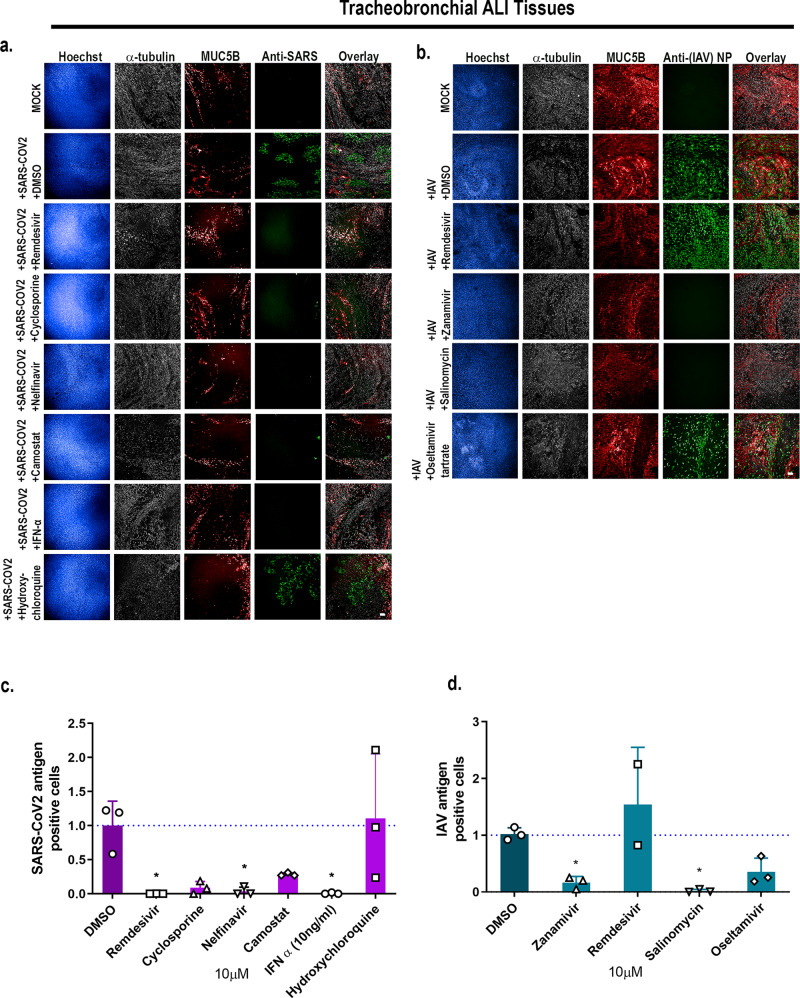
Fig. 8. Tracheobronchial and alveolar ALI tissue equivalents predictively measure antiviral compound response in the context of SARS-CoV-2 and IAV infections.
Selected compounds were added to the basal media chamber (10 μM final concentration) of the tracheobronchial and alveolar ALI tissues for 1 h and then infected with IAV PR8 (MOI of 0.1), and SARS-CoV-2 (MOI of 0.1). IAV and SARS-CoV-2 infected tissues were fixed for 24 and 36 hpi, respectively, and stained with antibodies against selected cell markers and viral specific antigens. a, b Tracheobronchial ALI tissues were stained with anti-α-tubulin (ciliated cell marker, white), anti-MUC5AC or anti-MUC5B (goblet cell marker, red), along with anti-N protein (green, right five panels) and anti-SARS-CoV-2 (monoclonal antibody cocktail targeting S and N proteins, green) as the marker of infected cells Scale bar is 100 μm. Image-based quantification of infected cells in compound treated and subsequent (c) SARS-CoV-2 or (d) IAV infected tracheobronchial ALI tissues. Data are represented as M ± SD for a minimum of n = 3 independent experiments and/or biological replicates except for the data from Remdesivir treated IAV infected tissues that has n = 2; Student t test of IAV or SARS-CoV-2 infected tissues vs. uninfected controls at each timepoint: *p < 0.05, **p < 0.005, ***p < 0.0005, ****p < 0.00005.

