
FIGURE 5.
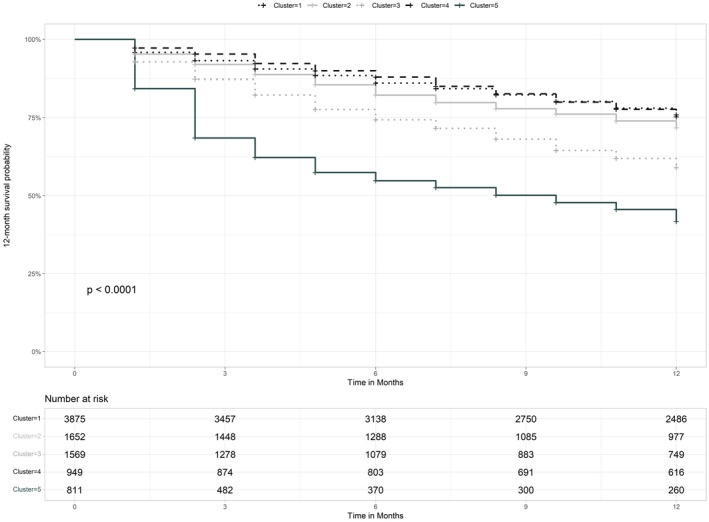
Kaplan–Meier curve of overall survival at 1 year by phenotype. p value: log‐rank test. Foot note: 12‐month survival rates for each phenotype are as follows: phenotype 1: 74.4%; phenotype 2: 70.5%; phenotype 3: 58.3%; phenotype 4: 74.7%; phenotype 5: 43.5%