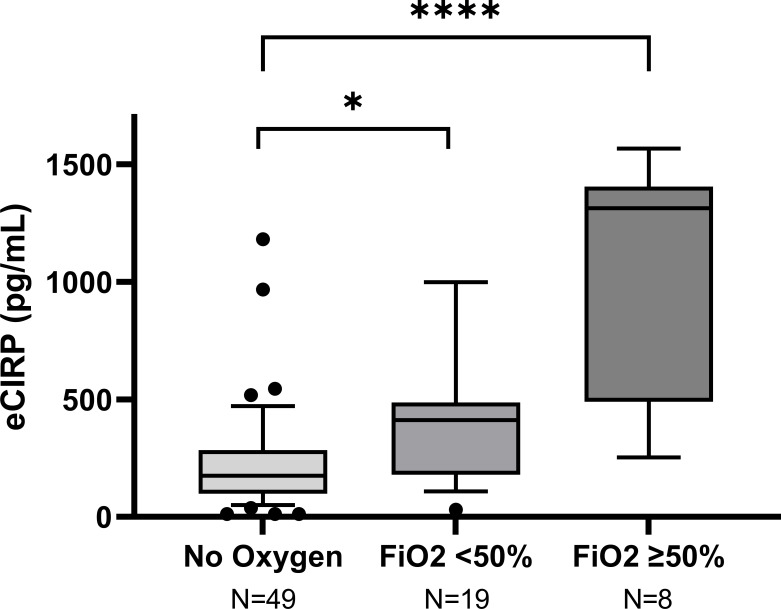
Figure 2.
Peak concentration of eCIRP in relation to COVID-19 severity in the Umeå cohort. Box-plots representing the highest eCIRP concentrations on day 0-4 after enrollment, grouped by COVID-19 severity in Umeå cohort. Mild disease: No oxygen treatment. Non-severe hypoxemia: Conventional oxygen treatment or HFNC with FiO2 <50%. Severe hypoxemia: Treatment with HFNC with FiO2 ≥50% or mechanical ventilation. *p<0.001, ****p<0.001.

