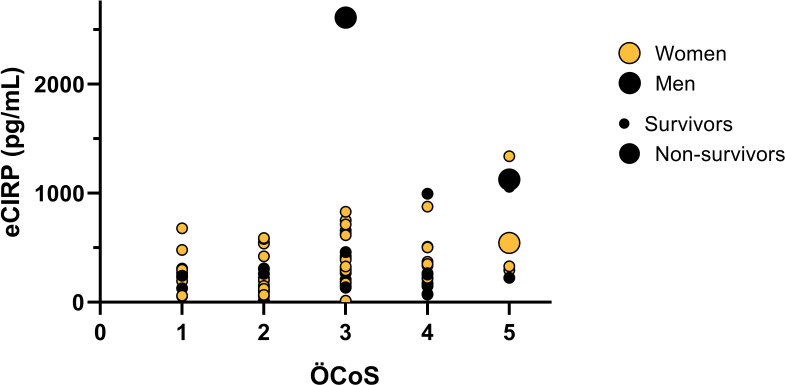
Figure 3.
Peak eCIRP concentrations in relation to the extent of pulmonary infiltration on chest CT. Multivariate bubble-plot of eCIRP-values, Örebro Covid-19 Scale (ÖCoS), sex, and outcome. Peak concentrations of eCIRP measured 0-4 days after enrollment. Maximal parenchymal infiltration in percent visualized by chest CT during hospitalization, graded by ÖCoS. ÖCoS ranges from 1-5, corresponding to the percentage of lung parenchymal involvement, ÖCoS 1 < 10%, ÖCoS 2 = 10-25%, ÖCoS 3 = 25-50%, ÖCoS 4 = 50-75%, and ÖCoS 5 > 75%. Orange dots: Women. Black dots: Men. Large dots: Non-survivors (both men and women). Small dots: Survivors (both men and women).

