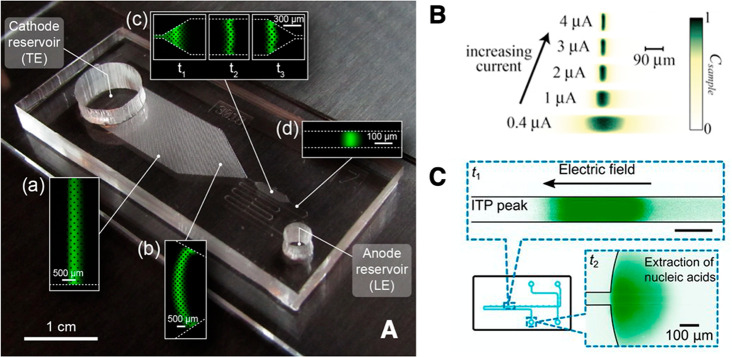
Figure 24.
Direct detection and visualization of peak-mode ITP in various microfluidic systems. (A) Fluorescence images of the peak-mode ITP focusing and preconcentration of dye SYTO9 at various axial positions in a custom large-volume PDMS–glass microfluidic chip. The figure was reproduced from with permission from ref (222). CC BY 4.0. (B) Peak-mode ITP focusing of the fluorescent dye AF488 vs various applied currents between 0.4 and 4 μA. Experiments were performed in a commercially available borosilicate glass microfluidic chip (NS12A, Caliper Life Sciences, MA). The figure was reproduced with permission from ref (34) Copyright 2012 JoVE. (C) Visualization of the ITP peak during the extraction, purification, and preconcentration of nucleic acids from a raw nasopharyngeal swab sample. Nucleic acids were stained using the fluorescent intercalating dye SYBR Green I. Experiments were performed in an NS12A Caliper chip (same as panel B). The figure was reproduced with permission from ref (94). Copyright 2020 National Academy of Sciences.

