
Figure 30.
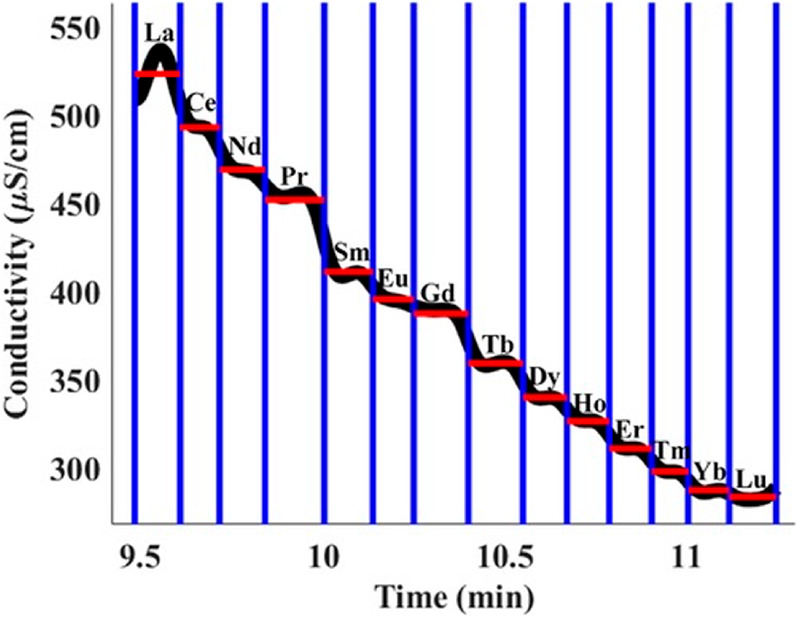
Experimental demonstration of the separation of trivalent lanthanides using plateau-mode ITP. A graph of the measured conductivity signals vs time is shown. The distance between the vertical lines represents the characteristic temporal band length. The mean conductivity signals for each lanthanide are indicated by horizontal lines. The figure was reproduced with permission from ref (359). Copyright 2019 John Wiley and Sons.