
Figure 4.
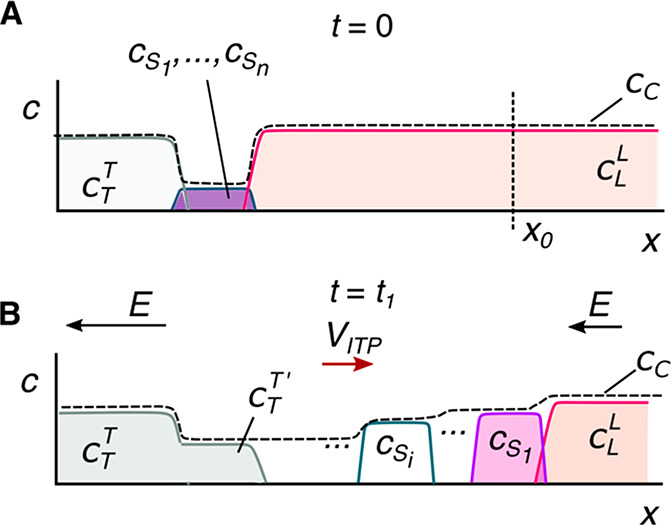
Concentration profiles for strong electrolytes in plateau-mode ITP. (A) Finite injection sample loading configuration. The sample contains a mixture of ions S1, ..., Sn, which focus in ITP. (B) Sample ions are focused and stack in the descending order of (magnitude of) mobility values between the LE and the TE. The vertical dashed line in panel A indicates an example location along the channel where we chose to illustrate the application of the Kohlrausch regulating function, as shown in section 3.5. The S1 ion and counterion at x = x0 must meet the KRF set by the LE zone that originally occupied this region.