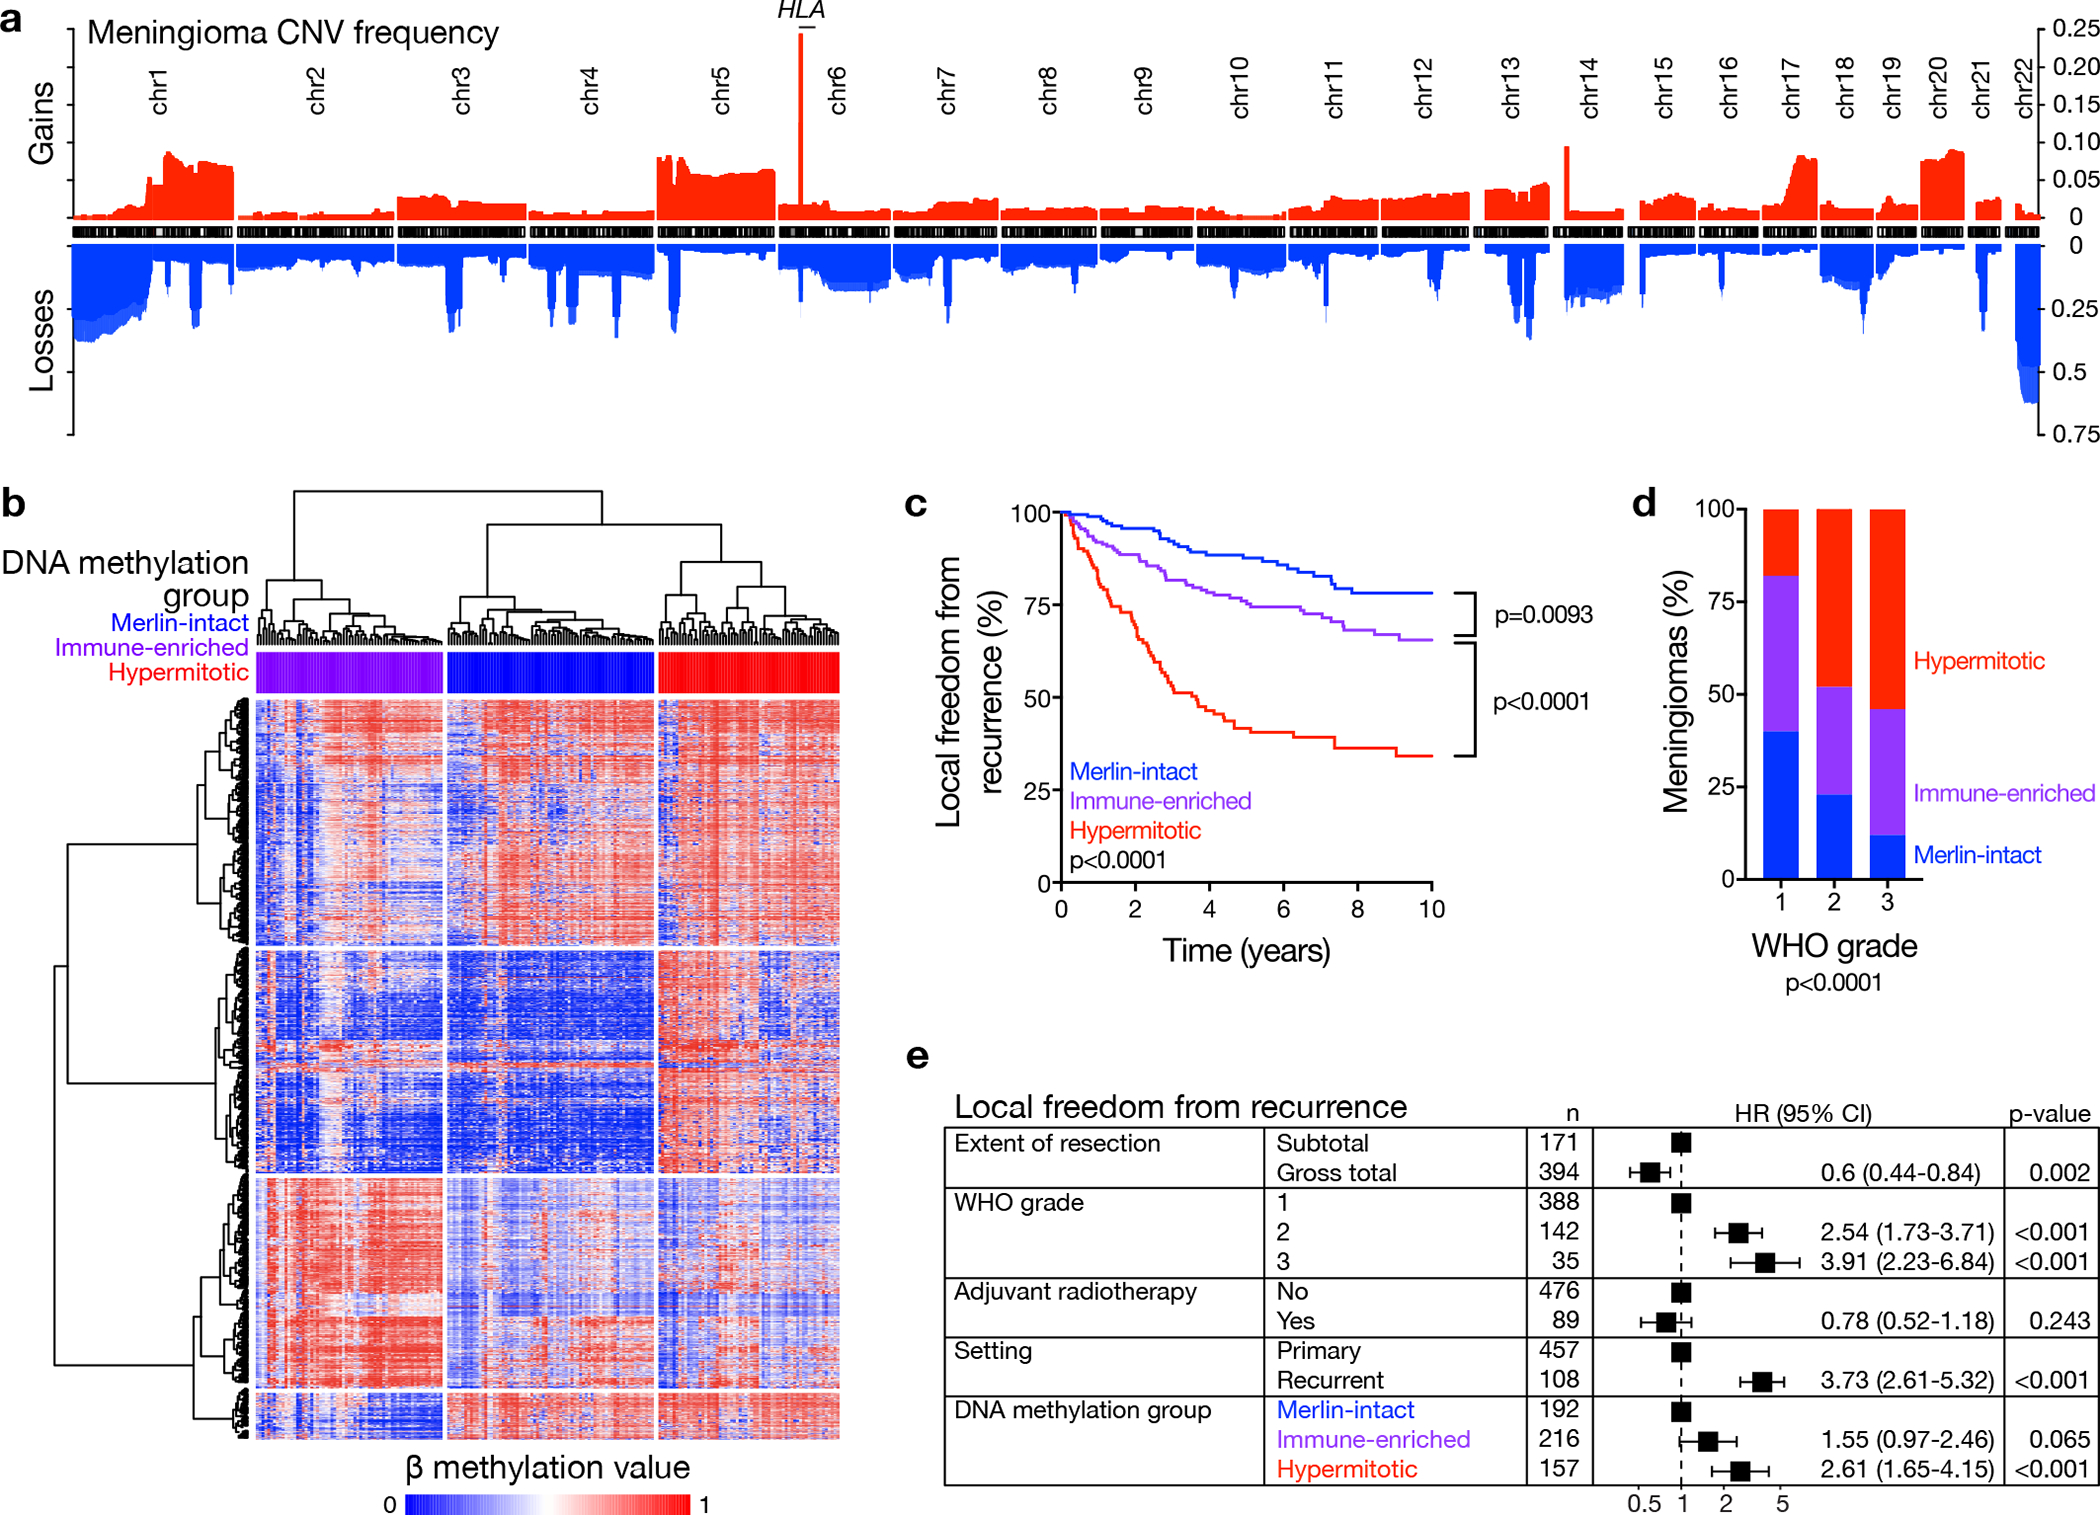
Figure 1. Meningiomas are comprised of 3 DNA methylation groups with distinct outcomes.

a, Frequency of copy number losses (blue) and gains (red) across the discovery and validation cohorts (n=565). b, Unsupervised hierarchical clustering of meningiomas from the discovery cohort (n=200) using 2000 differentially methylated DNA probes. c, Kaplan-Meier curves for meningioma local freedom from recurrence from the discovery and validation cohorts (n=565) across DNA methylation groups (Log-rank test). d, Meningioma WHO grades (n=565) across DNA methylation groups (Chi-squared test, two-sided). e, Multivariable regression hazard ratio (HR) forest plots for local freedom from recurrence using meningioma clinical variables and DNA methylation groups (n=565, Cox proportional hazards model, Wald test, two-sided, no adjustment for multiple comparisons). Boxes represent means, and error bars represent 95% confidence intervals (CI).
