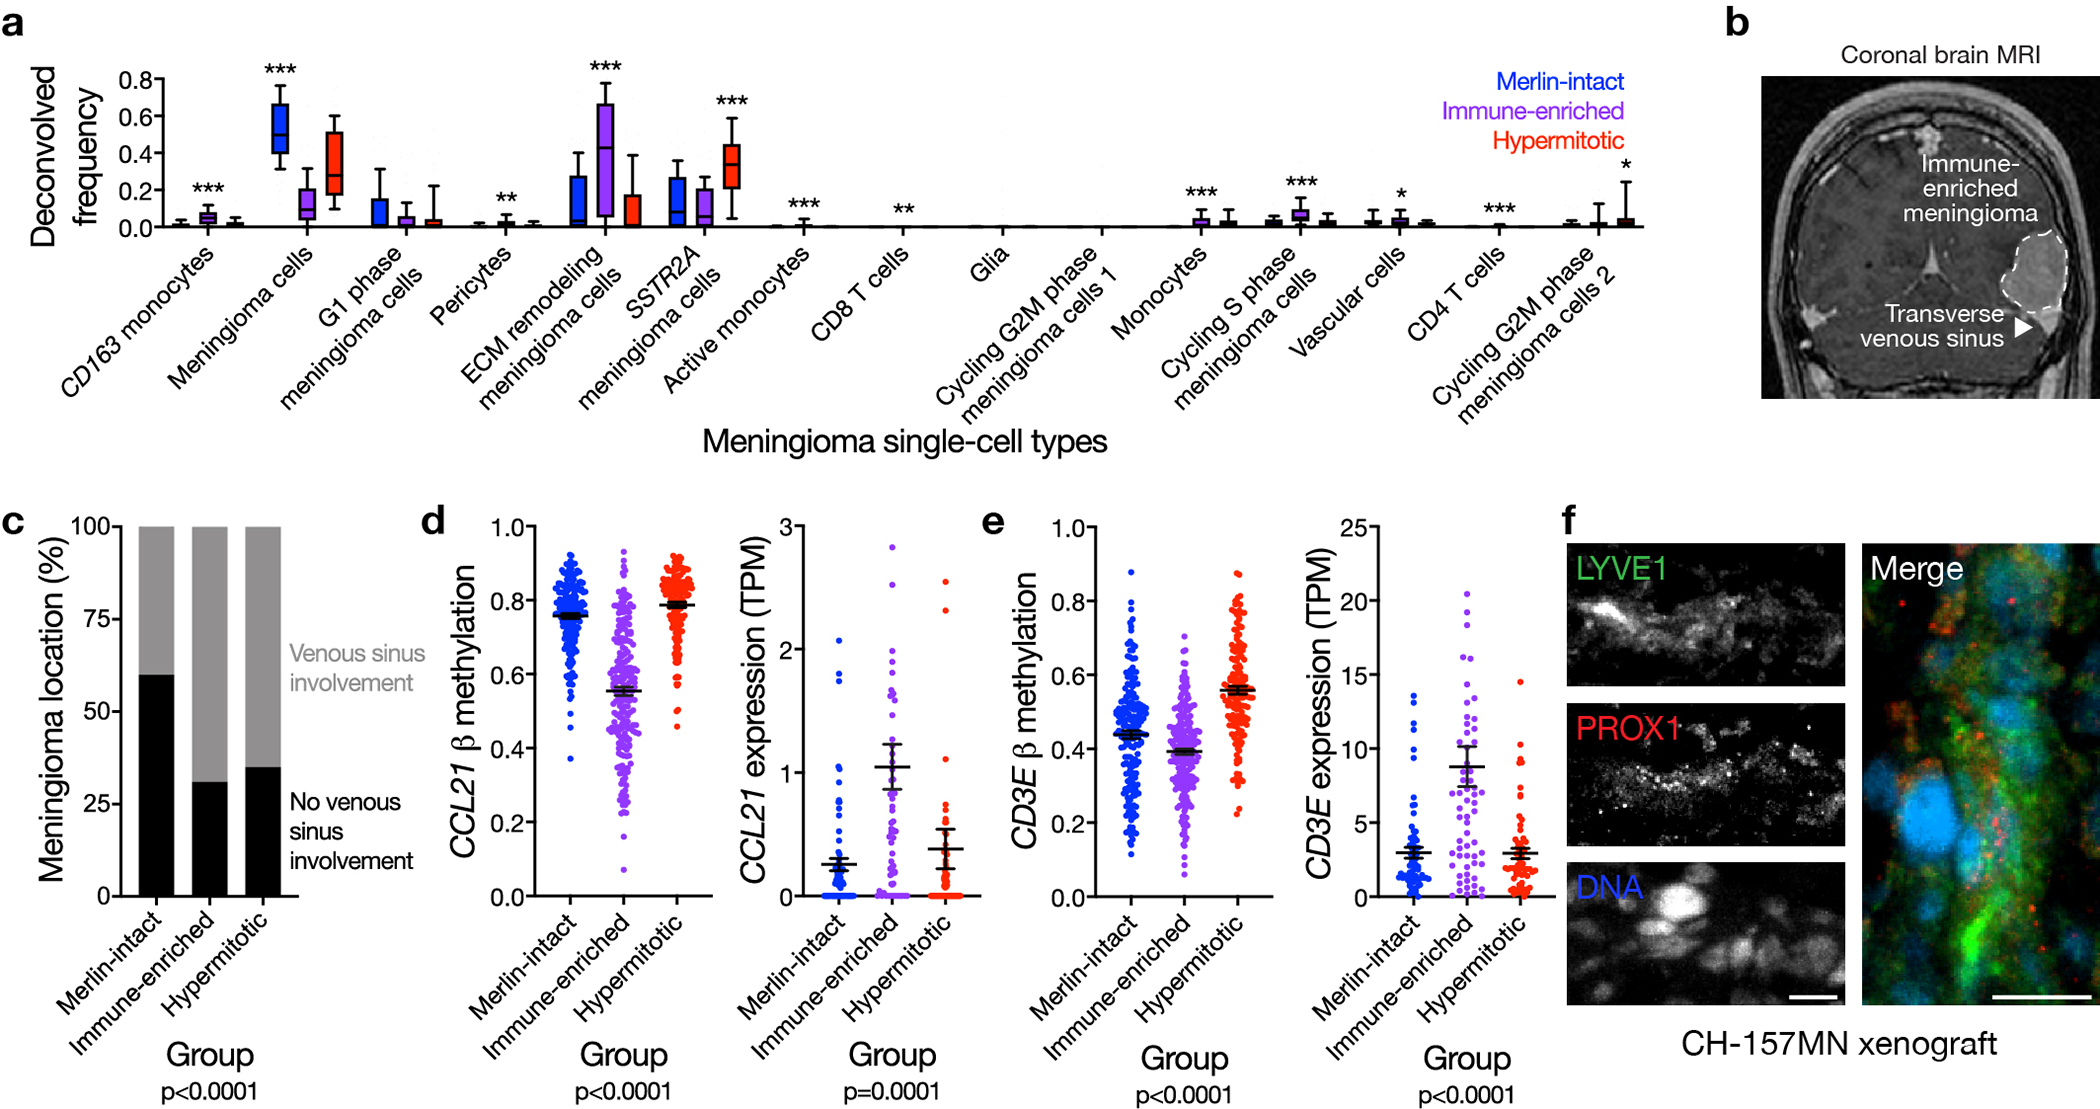
Extended Data Fig. 6. Lymphatic vessels underlie meningioma immune infiltration.

a, Fraction of meningioma samples (n=200) classified meningioma single-cell types across DNA methylation groups, based on single-cell reference transcriptomes. Lines represent means, boxes represent inner quartile ranges, and error bars represent 10th-90th percentiles (ANOVA, one-sided). b, c, Meningioma location on preoperative magnetic resonance imaging (n=169) across DNA methylation groups (Chi-squared test, two-sided). Representative magnetic resonance image shown. d, Meningioma DNA methylation (n=565) of CCL21 (cg27443224) and TPM expression (n=200) of CCL21 across DNA methylation groups (ANOVA, one-sided). e, Meningioma DNA methylation (n=565) of CD3E (cg08956138) and TPM expression (n=200) of CD3E across DNA methylation groups (ANOVA, one-sided). f, Representative image of LYVE1 and PROX1 confocal immunofluorescence microscopy in CH157-MN xenografts in NU/NU mice (n=3). DNA is marked with Hoechst 33342. Scale bars 10 μM. Lines represent means, and error bars represent standard error of the means. *p≤0.05, **p≤0.01, ***p≤0.0001.
