
Figure 3. HLA expression and meningeal lymphatics underlie meningioma immune enrichment.
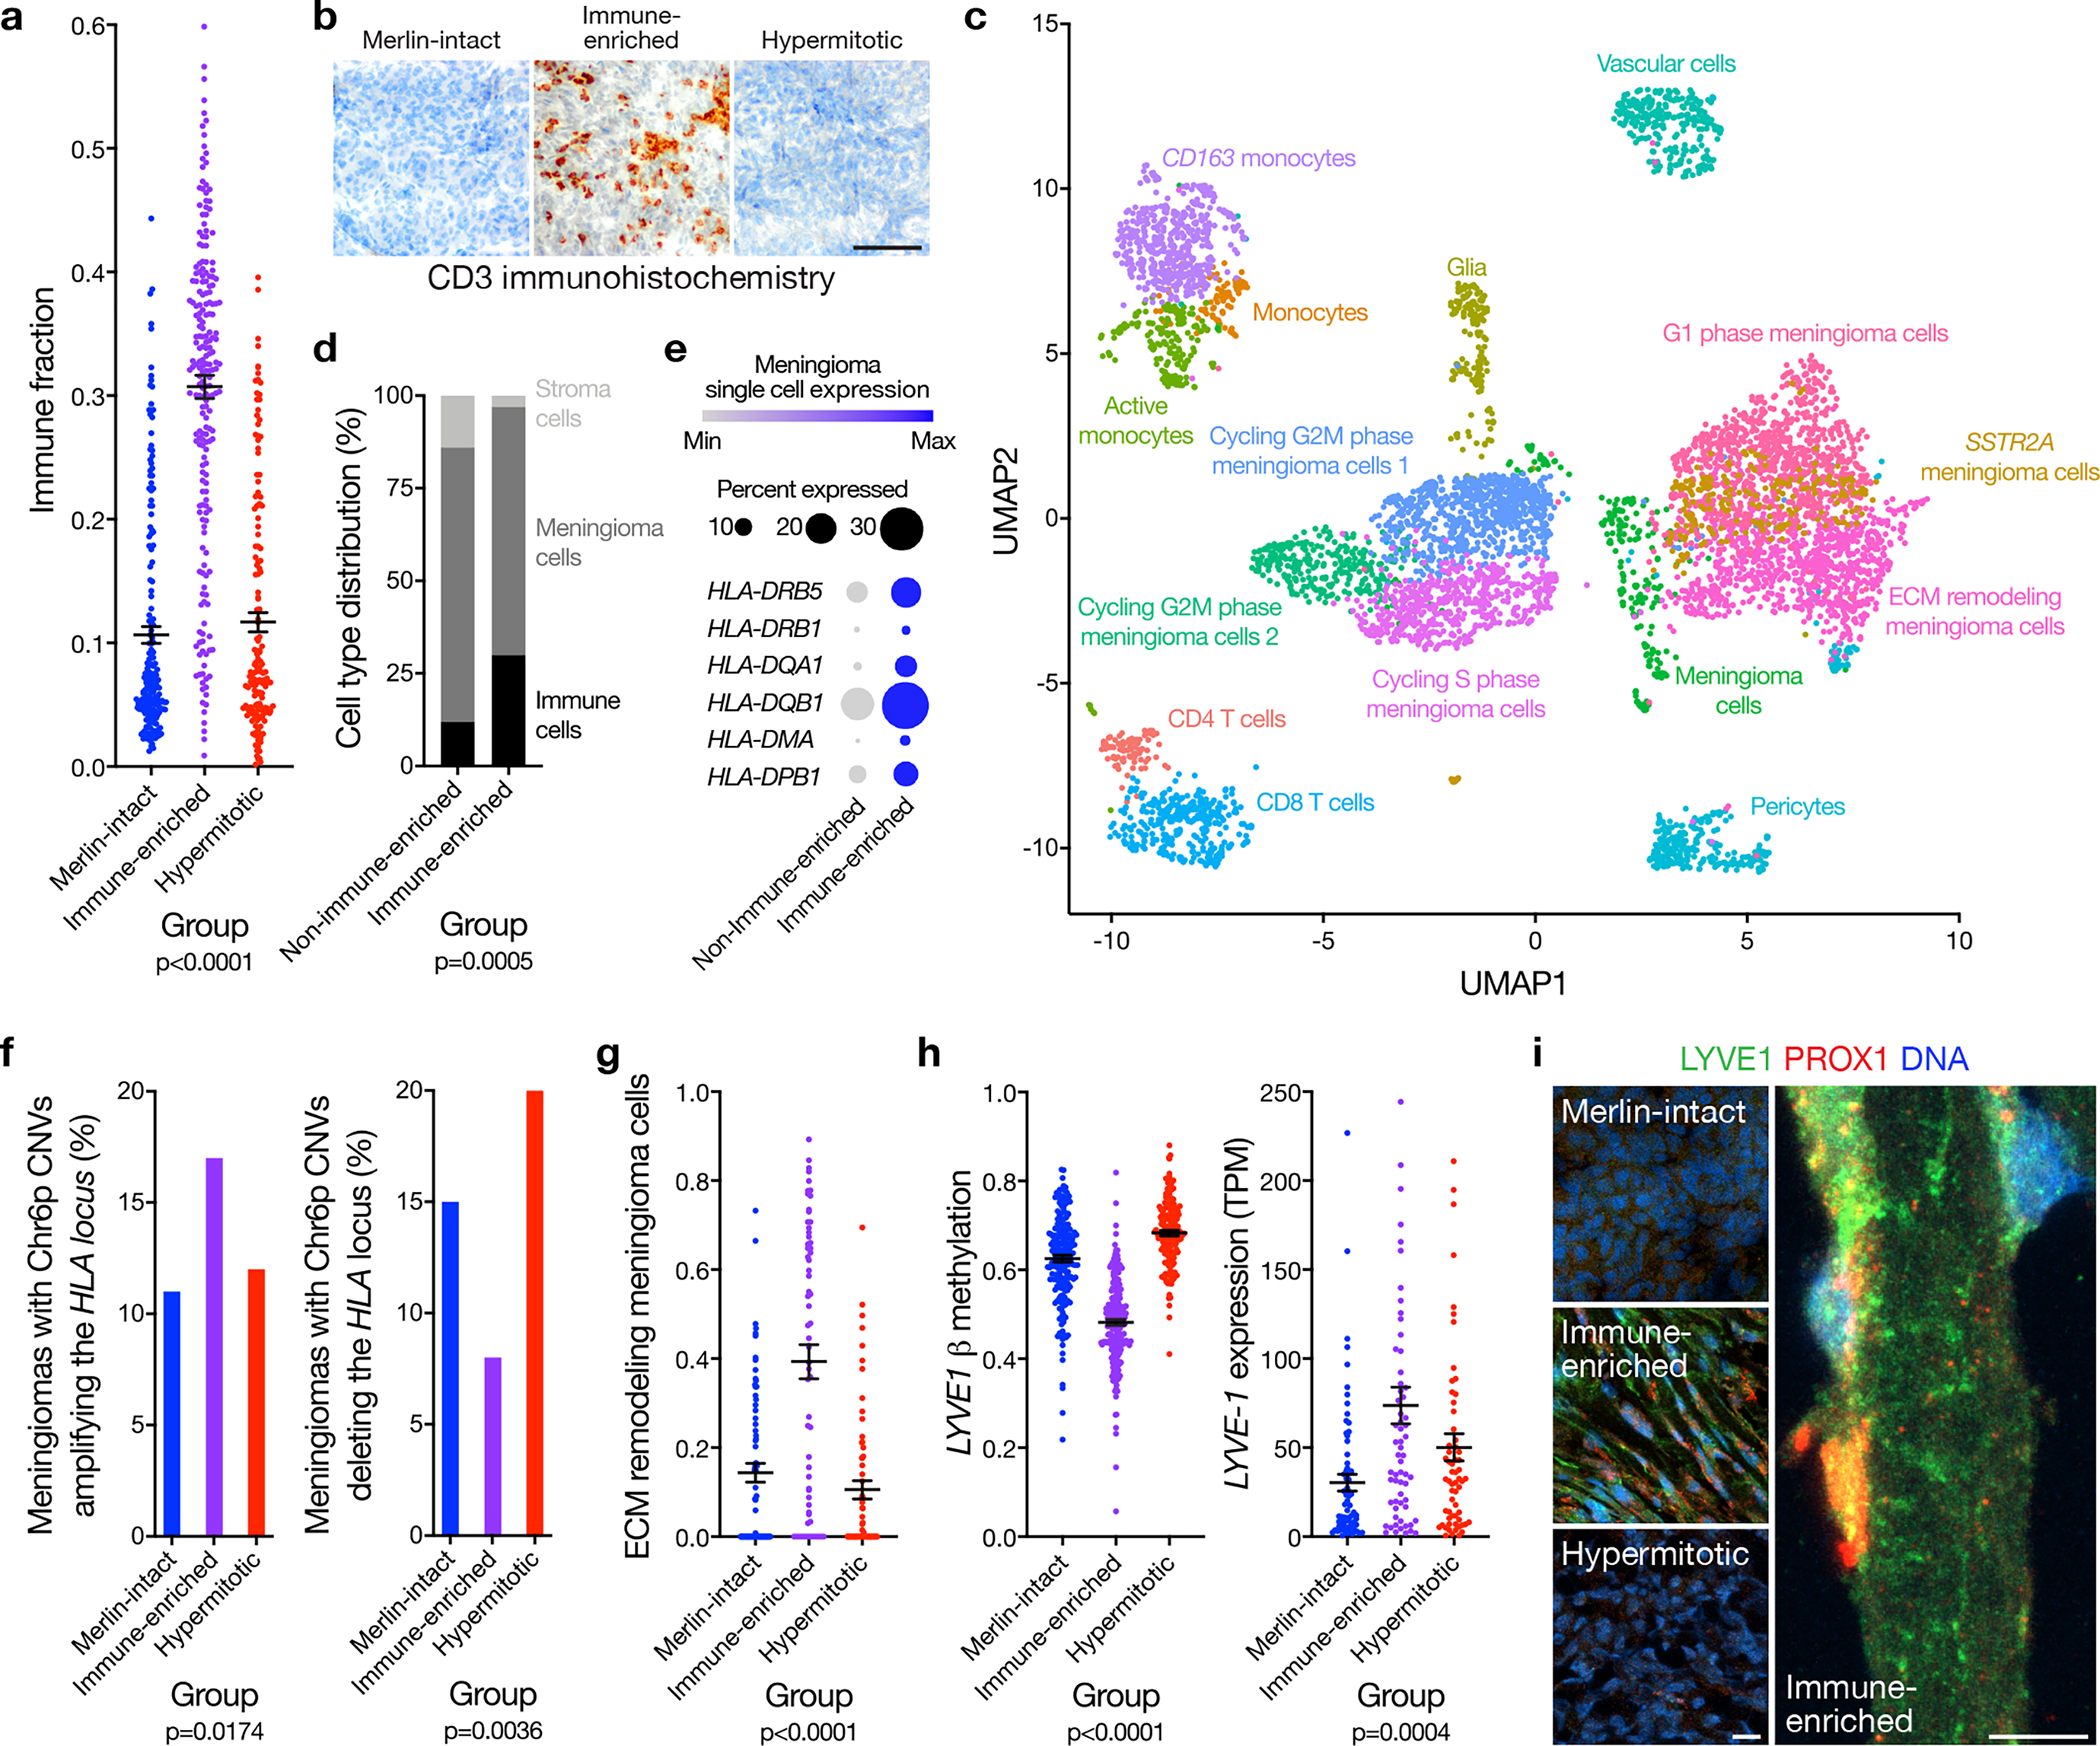
a, Meningioma DNA methylation leukocyte fractions (n=565) across DNA methylation groups (ANOVA, one-sided). b, Representative images of T cell immunohistochemistry across meningioma DNA methylation groups (n=87, p<0.0001, Chi-squared test, two-sided). Scale bar 100 μM. c, UMAP of single-cell RNA sequencing transcriptomes of 57,114 cells from 8 human meningioma samples and 2 human dura samples, colored by assignments from Louvain clustering. d, Quantification of single-cell types from c in Immune-enriched (n=5) and non-Immune-enriched (n=3) meningioma samples (Chi-squared test, two-sided). e, Single-cell RNA sequencing relative expression of HLA genes in meningioma cells across Immune-enriched (n=5) and non-Immune-enriched (n=3) meningioma samples. Circle size denotes percentage of cells. Shading denotes average expression. f, Meningioma DNA methylation analysis of chromosome 6p segment CNVs containing the entire polymorphic HLA locus encompassing HLA-DRB5, HLA-DRB1, HLA-DQA1, and HLA-DQB1 across Merlin-intact (n=192 meningiomas, 21 gains, 28 losses), Immune-enriched (n=216 meningiomas, 37 gains, 18 losses), and Hypermitotic (n=157 meningiomas, 12 gains, 32 losses) DNA methylation groups (Chi-squared test, two-sided). g, Fraction of meningioma samples (n=200) classified as extracellular matrix (ECM) remodeling meningioma cells across DNA methylation groups, based on single-cell reference transcriptomes from c (ANOVA, one-sided). h, Meningioma DNA methylation (n=565) of LYVE1 (cg26455970) and transcripts per million (TPM) expression (n=200) of LYVE-1 across DNA methylation groups (ANOVA, one-sided). i, Representative images of meningioma LYVE1 and PROX1 immunofluorescence microscopy across DNA methylation groups (n=12). DNA is marked with Hoechst 33342. Scale bars 10 μM. Lines represent means, and error bars represent standard error of the means.