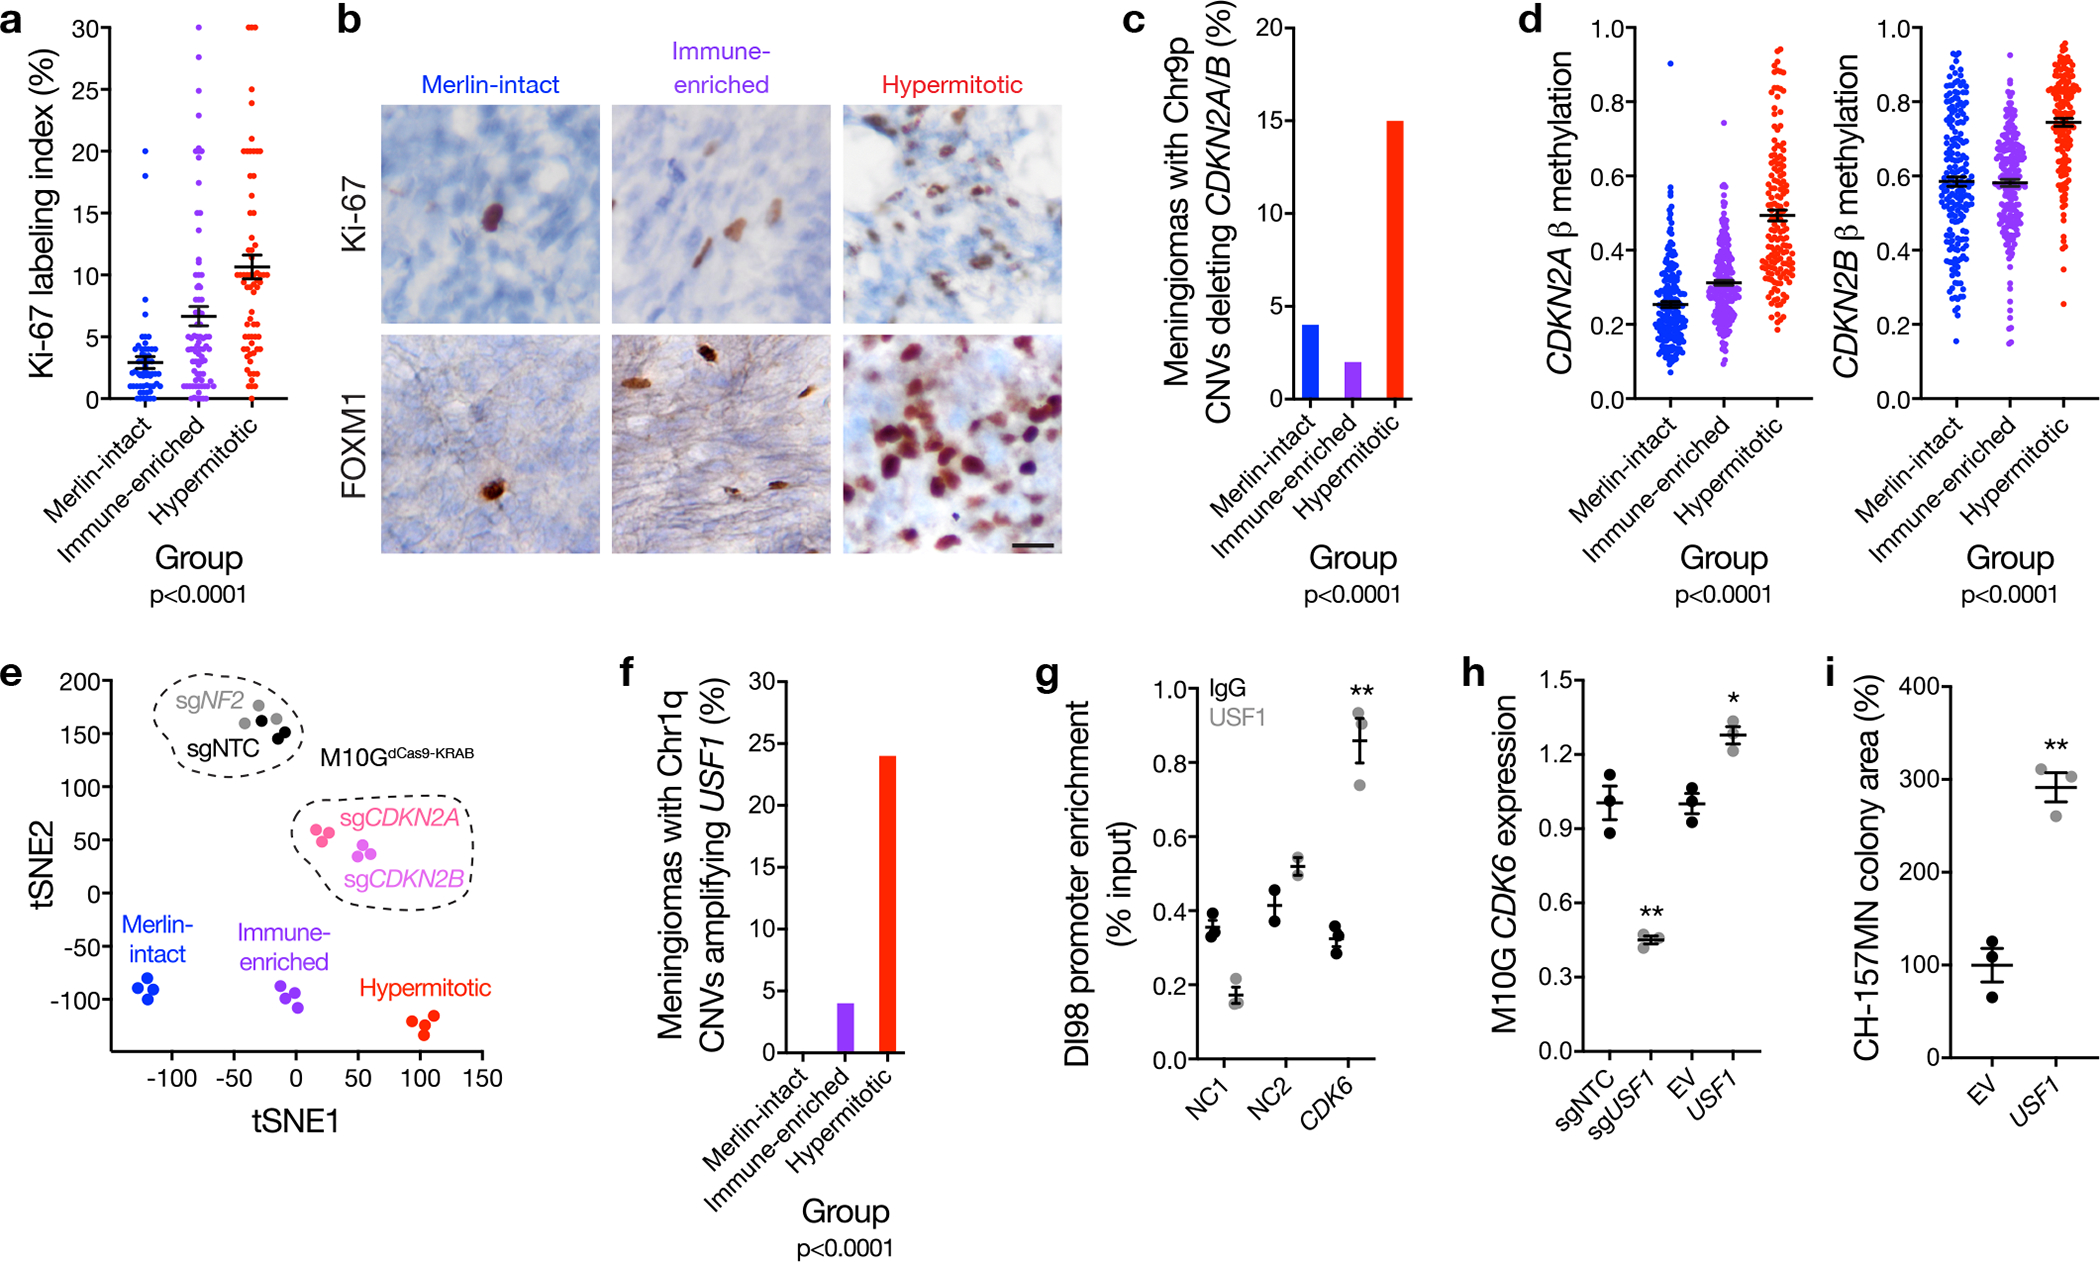
Figure 4. Convergent genetic and epigenetic mechanisms misactivate the cell cycle in meningioma.

a, Ki-67 labeling index from meningioma clinical pathology reports (n=206) across DNA methylation groups (ANOVA, one-sided). b, Representative images of meningioma Ki-67 and FOXM1 immunohistochemistry (n=92) across meningioma DNA methylation groups. Scale bar 10 μM. c, Meningioma DNA methylation analysis of chromosome 9p segment copy number deletions of any size containing the entire CDKN2A/B locus across Merlin-intact (n=8 of 192 meningiomas, 4%), Immune-enriched (n=5 of 216 meningiomas, 2%), and Hypermitotic (n=24 of 157 meningiomas, 15%) DNA methylation groups (n=565, Chi-squared test, two-sided). d, Meningioma DNA methylation (n=565) of CDKN2A (cg26349275) or CDKN2B (cg08390209) across DNA methylation groups (ANOVA, one-sided). e, tSNE plot of meningioma and meningioma cell line DNA methylation profiles. Four representative meningiomas from each DNA methylation group are shown. Triplicate meningioma M10GdCas9-KRAB cultures stably expressing a non-targeting control single-guide RNA (sgNTC) or single-guide RNAs suppressing NF2 (sgNF2), CDKN2A (sgCDKN2A), or CDKN2B (sgCDKN2B) are shown. Differences in DNA methylation groups are captured in tSNE1, and a positive shift from Immune-enriched meningiomas to Hypermitotic meningiomas mimics the shift from M10GdCas9-KRAB-sgNTC and M10GdCas9-KRAB-sgNF2 cells to M10GdCas9-KRAB-sgCDKN2A and M10GdCas9-KRAB-sgCDKN2B cells. Differences between tumors and cell lines, such as the tumor microenvironment, are captured in tSNE2. f, Meningioma DNA methylation analysis of chromosome 1p segment copy number amplifications of any size containing the entire USF1 locus across Merlin-intact (n=0 of 192 meningiomas, 0%), Immune-enriched (n=2 of 216 meningiomas, 4%), and Hypermitotic (n=38 of 157 meningiomas, 24%) DNA methylation groups (n=565, Chi-squared test, two-sided). g, USF1 ChIP-QPCR in DI98 meningioma cells for the CDK6 promoter compared to negative control primers targeting a gene desert (NC1) or a gene not predicted to be bound by USF1 (NC2) from ChIP sequencing. **p=0.001 (Student’s t test, one-sided, no adjustment for multiple comparisons). h, QPCR for CDK6 in M10GdCas9-KRAB cells expressing sgNTC or a single-guide RNA suppressing USF1 (sgUSF1), or M10G cells over-expressing USF1 or empty vector (EV). *p=0.003, **p=0.001 (Student’s t test, one-sided, no adjustment for multiple comparisons). i, Relative colony area of CH-157MN cells stably over-expressing USF1 or EV after 10 days of clonogenic growth. **p=0.001 (Student’s t test, one-sided, no adjustment for multiple comparisons). Lines represent means, and error bars represent standard error of the means.
