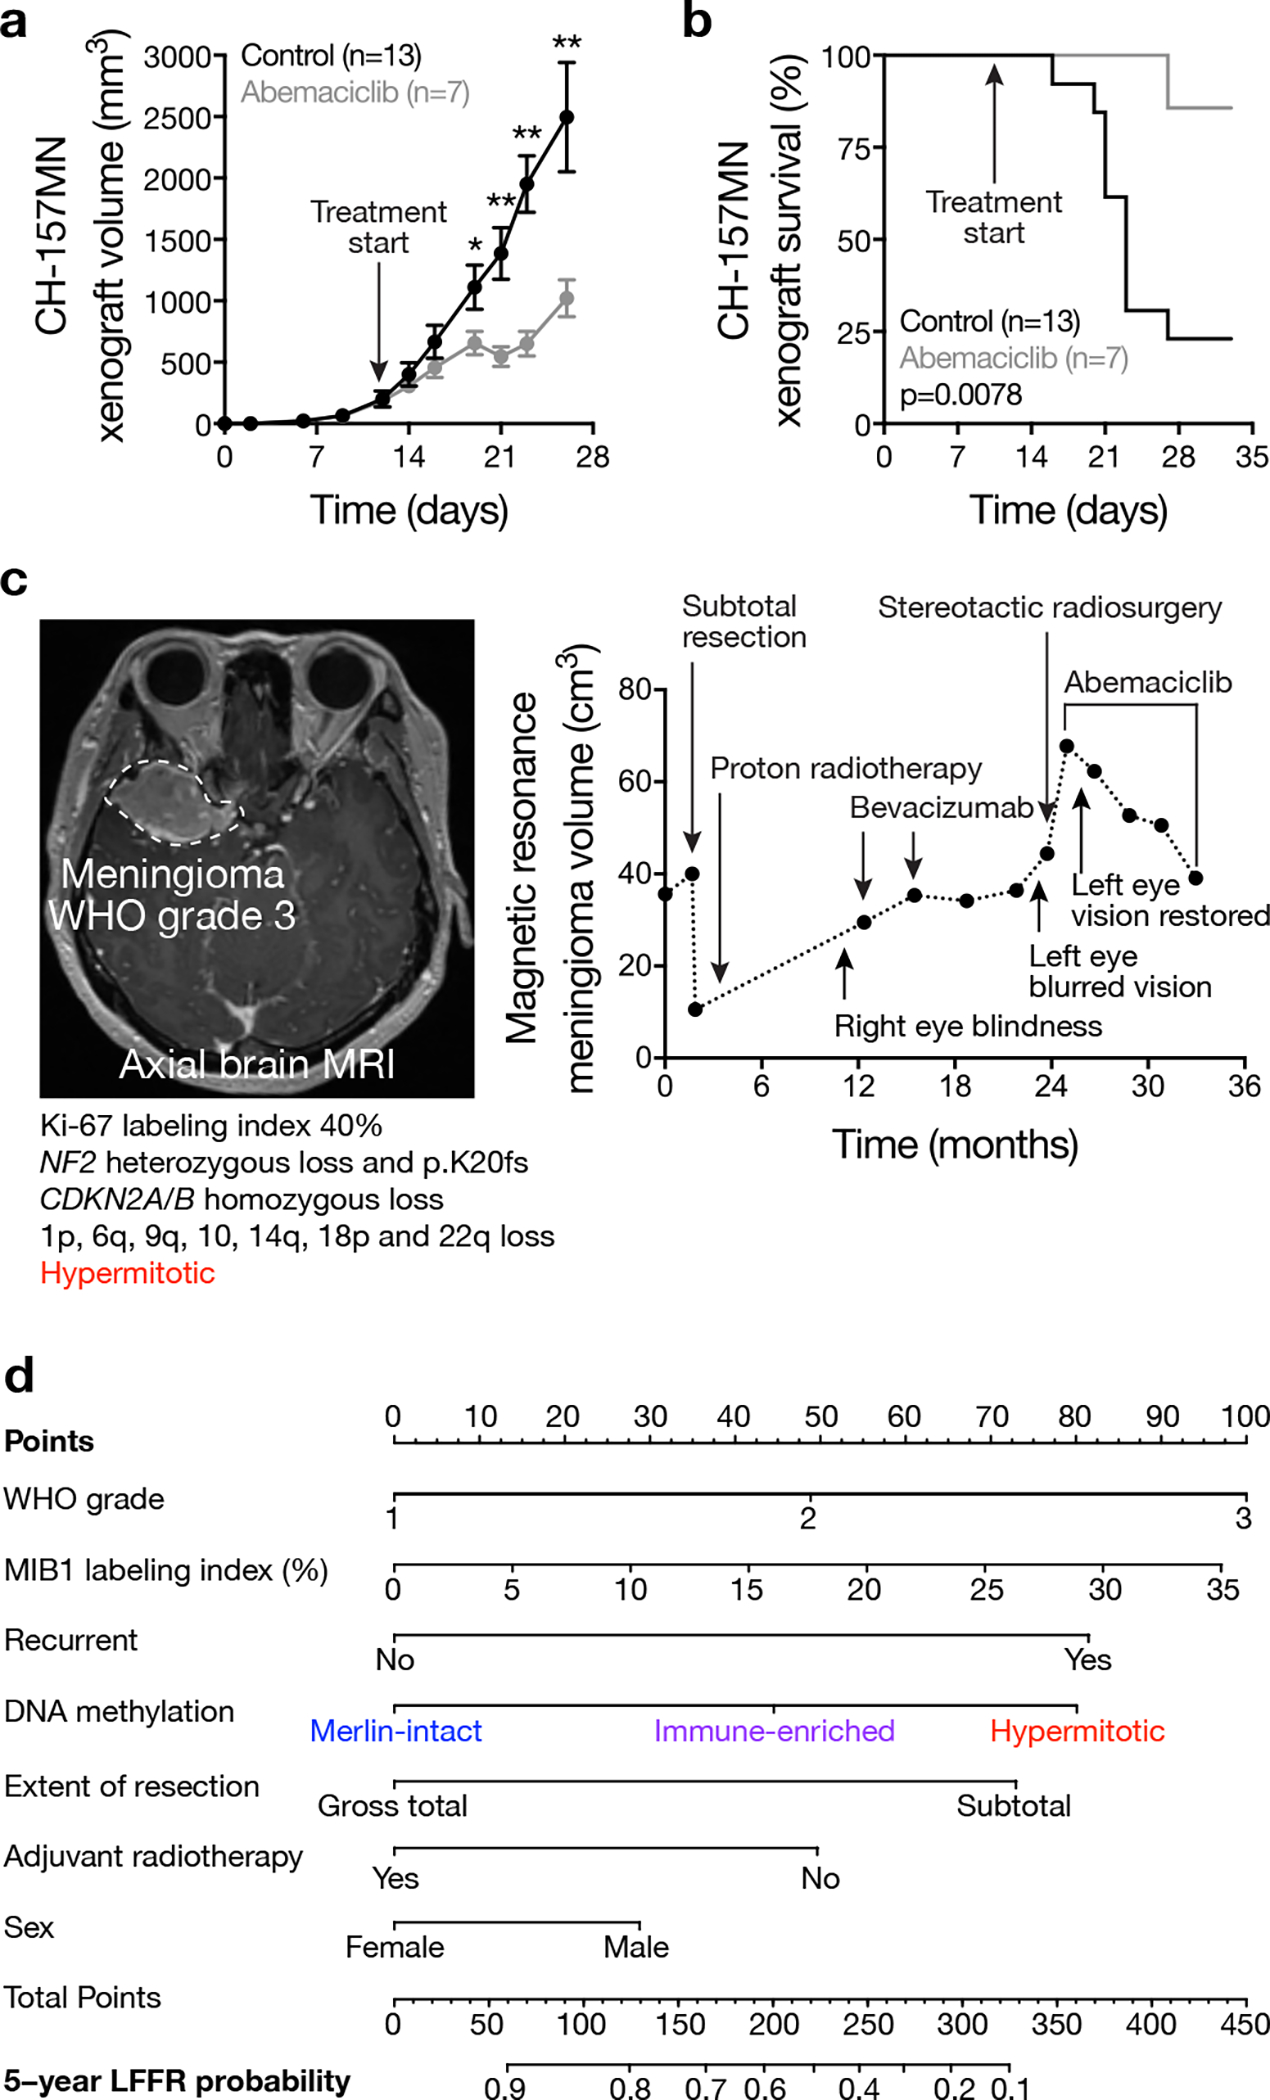
Figure 5. Clinical translation of meningioma DNA methylation groups.

a, Subcutaneous CH-157MN xenograft measurements in NU/NU mice treated with abemaciclib (100 μg/g) by daily oral gavage with versus control. Lines represent means, and error bars represent standard error of the means. *p≤0.05, **p≤0.01 (Student’s t tests, one-sided). b, Kaplan-Meier curve for CH-157MN xenograft overall survival in NU/NU mice treated as in c (Log-rank test). c, Magnetic resonance imaging and molecular features of a representative human meningioma (left) that was resistant to cytotoxic therapies but responded to cytostatic cell cycle inhibition (right). d, Nomogram for meningioma local freedom from recurrence (LFFR, n=201) integrating clinical features and DNA methylation groups. Variables contribute points (top row), which estimate the probably of 5-year LFFR (bottom rows) (https://william-c-chen.shinyapps.io/RaleighLab_MethylationSubgroupNomogram/).
