
Extended Data Fig. 1. DNA methylation analysis using SeSAMe to control for the influence of CNVs on β values identifies 3 groups of meningiomas.
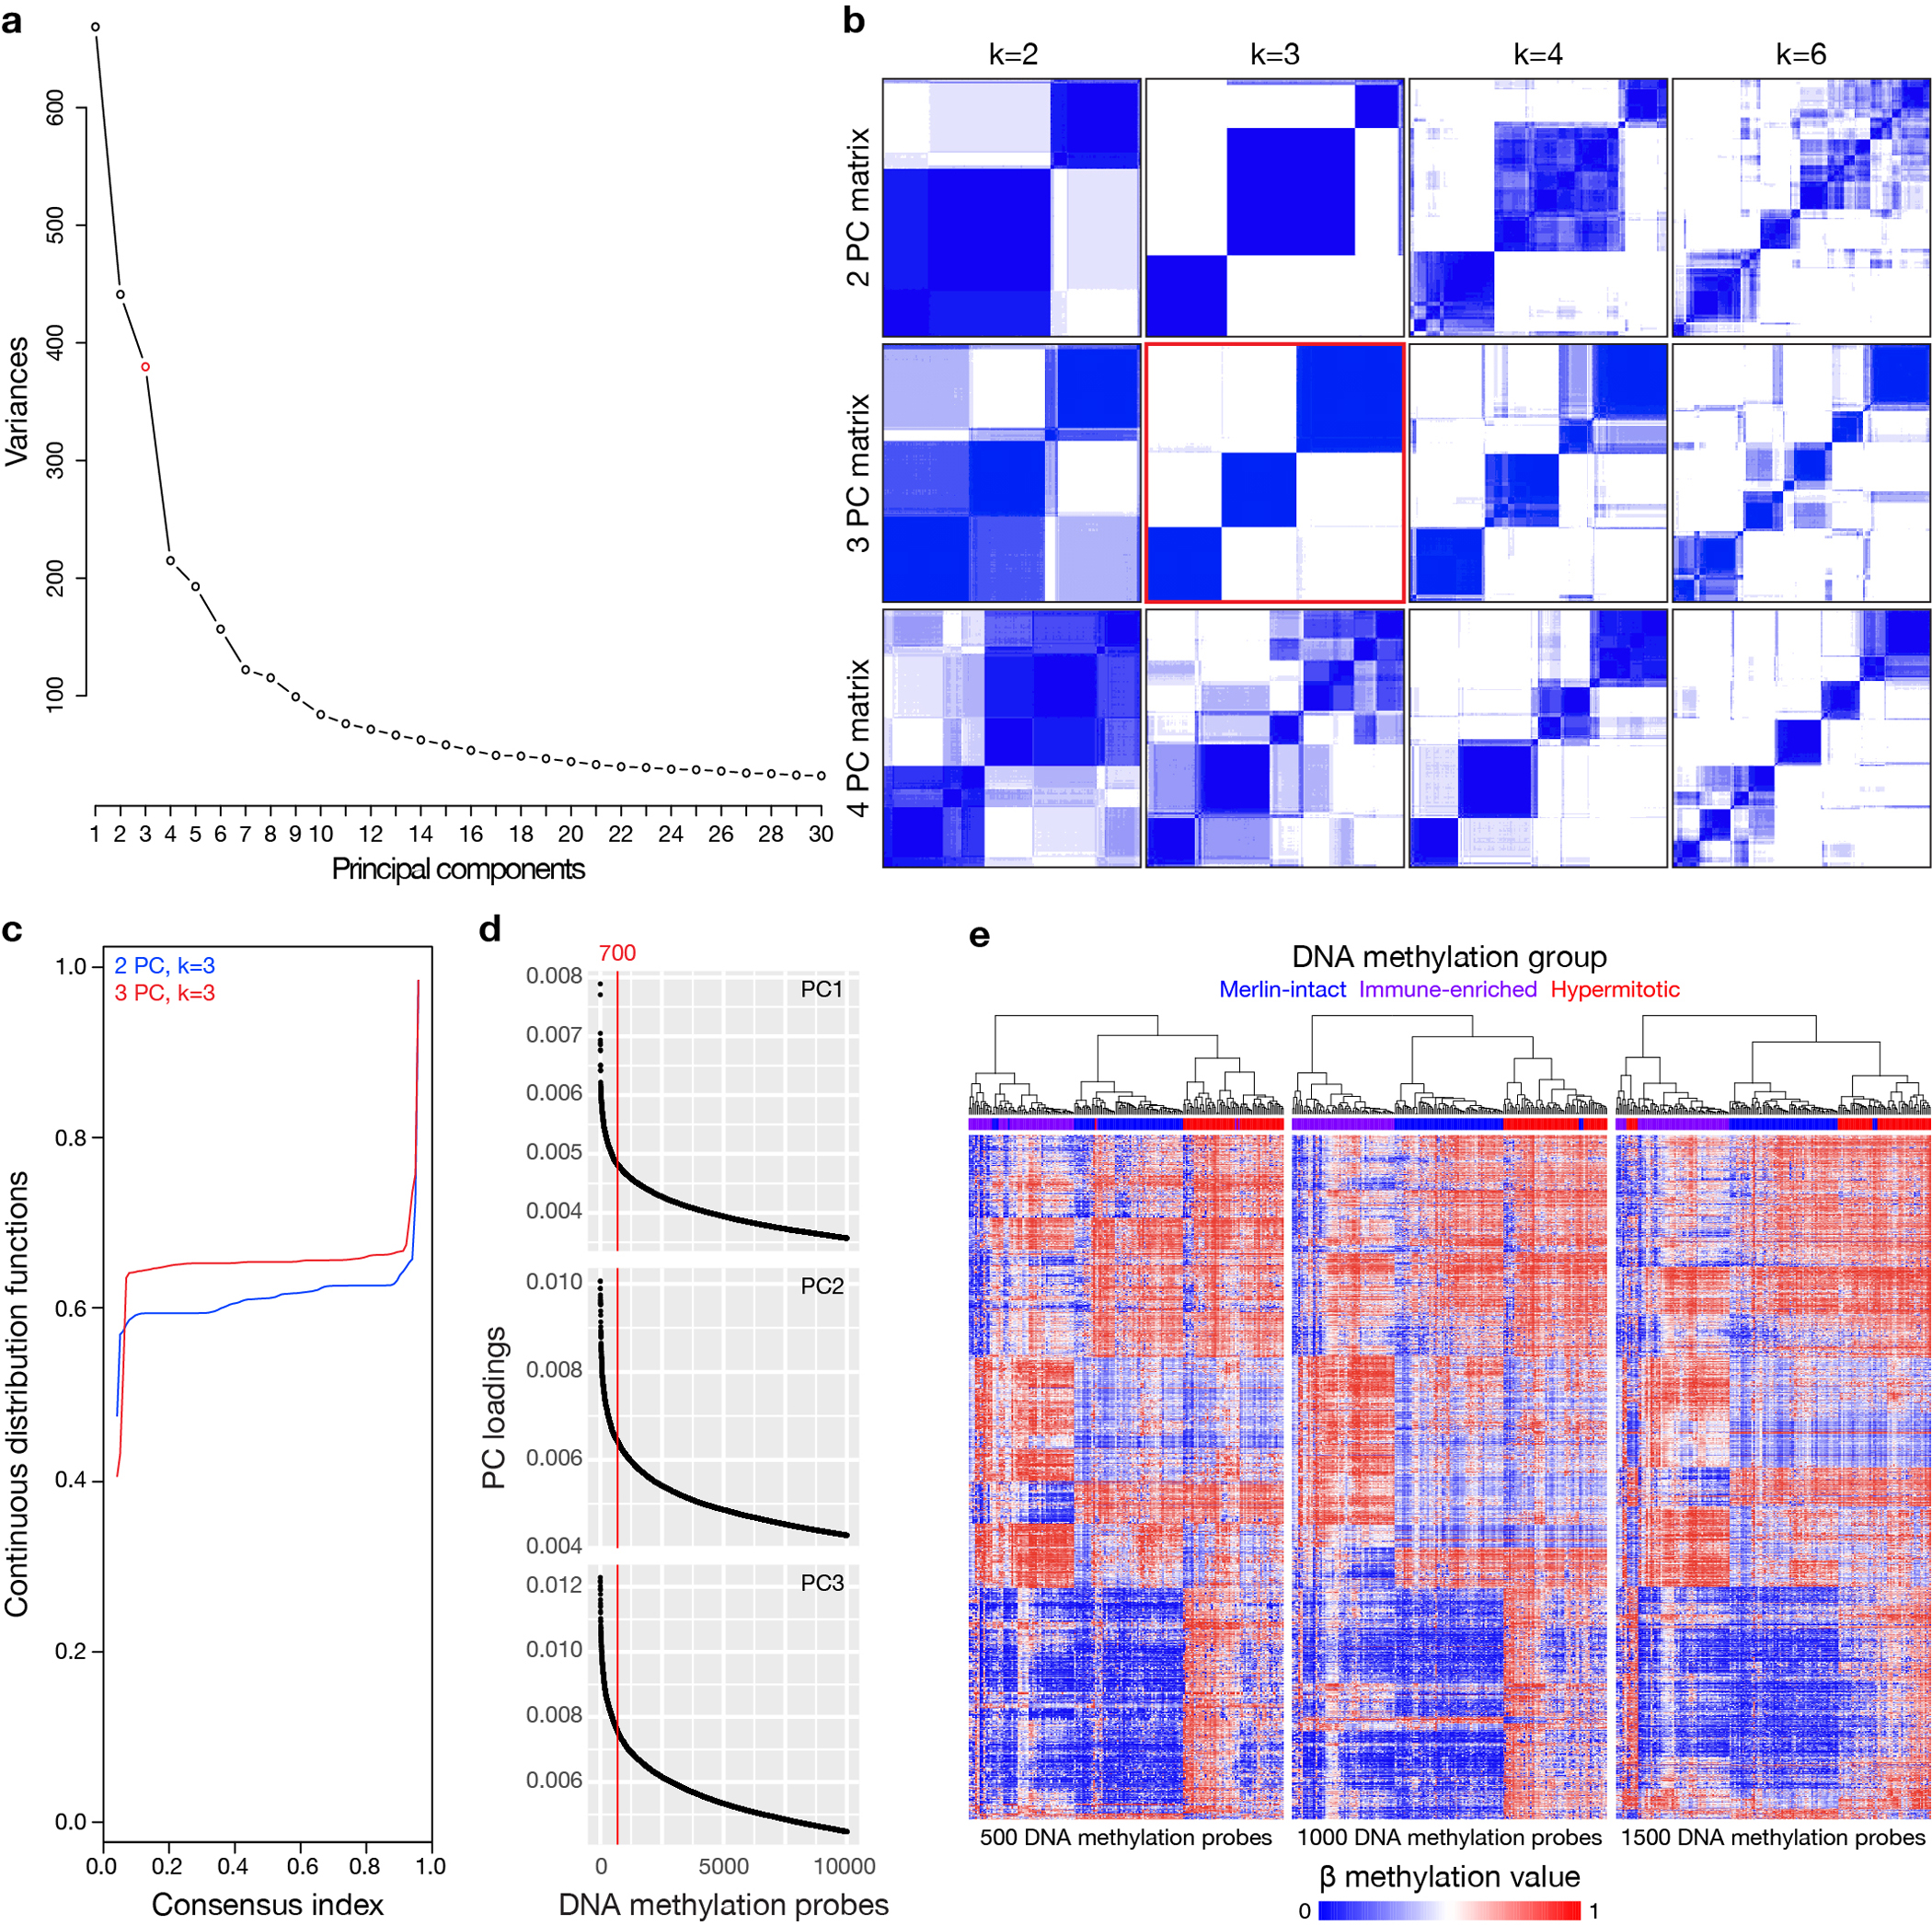
a, Scree/elbow plot of principal component analysis (PCA) of meningioma DNA methylation profiles suggesting differentially methylated DNA probes from the top 3 to 4 principal components (PCs) provide the most information in the discovery cohort (n=200). b, K-means consensus clustering of meningioma DNA methylation profiles from the discovery cohort (n=200) using differentially methylated DNA probes from the top 2–4 PCs across k=2–7 groups, suggesting 3 PCs and k=3 groups are optimal. c, Continuous distribution functions from K-means consensus clustering of meningiomas from the discovery cohort (n=200) using differentially methylated DNA probes from the top 2 or 3 PCs across k=3 groups, validating 3 PCs as the optimal number (p<2.2×10⁻¹⁶, Kolmogorov-Smirnov test). d, Distribution of absolute DNA methylation probe loadings across the top 3 PCs from the discovery cohort (n=200) for the top 10,000 probes for each PC. Loading distribution plots for each PC were similar, and the top 700 probes for each PC were selected using the elbow method for meningioma clustering. e, Unsupervised hierarchical clustering of meningiomas from the discovery cohort (n=200) using 500, 1000, or 1500 differentially methylated DNA probes from each PC demonstrating the precise number of probes from each PC does not significantly influence meningioma DNA methylation grouping. In comparison to Figure 1b, altering the number of probes for meningioma DNA methylation grouping only altered assignments for 3–9 meningiomas (1–4%). Merlin-intact (blue), Immune-enriched (purple), and Hypermitotic (red) DNA methylation group assignments are from Figure 1b.