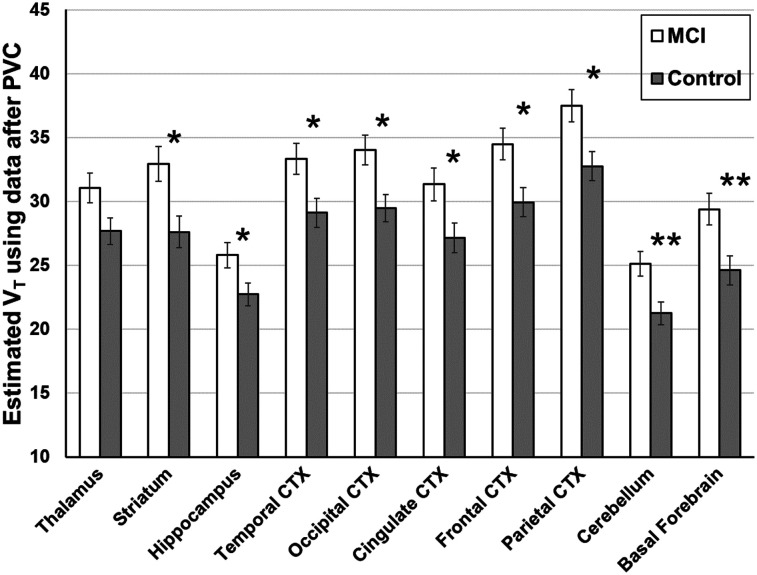
FIGURE 1.
Higher 18F-ASEM regional VT was found in 14 participants with MCI than in 17 cognitively intact healthy control participants, after accounting for age. Box plot diagram of 18F-ASEM VT was derived from images after PVC across 10 regions of interest. A linear mixed-effects regression model adjusting for age and brain region demonstrated higher VT in MCI patients than in controls. In secondary analyses, a regional difference for each region except thalamus was found between MCI patients and controls using individual linear regression models fit for region of interest and controlling for age (*P < 0.05; **P < 0.01). These differences in individual regions did not remain significant after Bonferroni adjustment for 10 regions tested, which required P < 0.005. VT is in units of mL cm−3. CTX = cortex.

