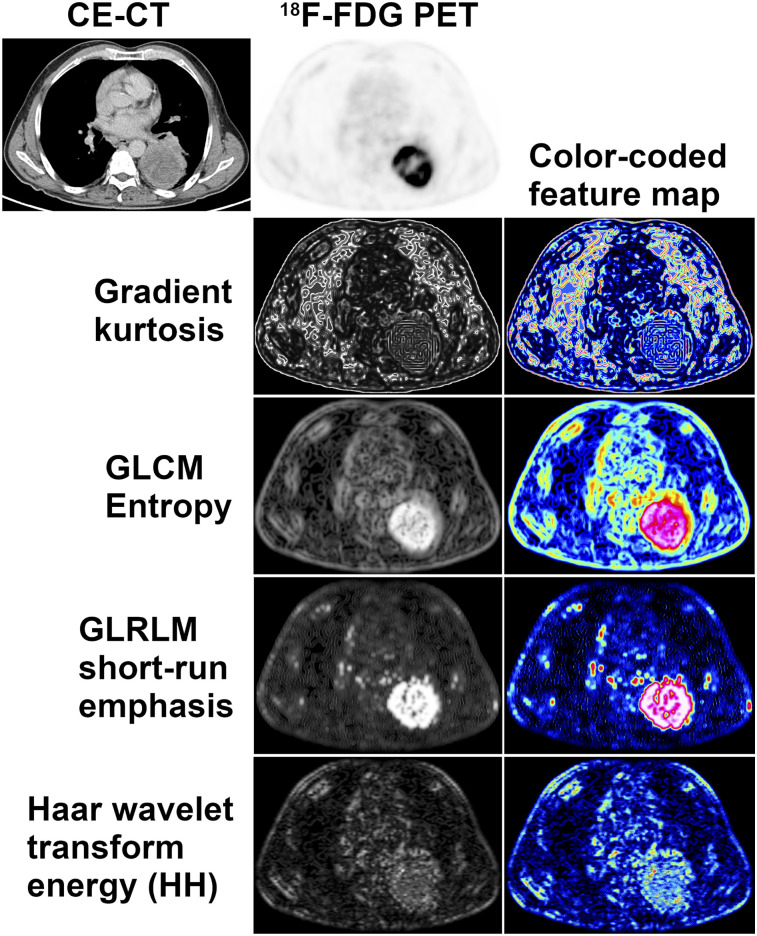
FIGURE 1.
Visual representation of radiomic features: 18F-FDG PET and contrast-enhanced CT images of partly necrotic lung cancer of left lower lobe. Radiomic feature maps generated by moving small rectangular window over PET image, and calculating feature value for each position, reflect different aspects of glucose metabolism heterogeneity across tumor. Each feature map depicts a single radiomic feature, with high values corresponding to high signal intensities on gray-level feature map. Color-coded feature maps may be used for better visualization and as color overlay for CT. CE = contrast-enhanced; HH = high–high, or high-pass filtering in both directions.

