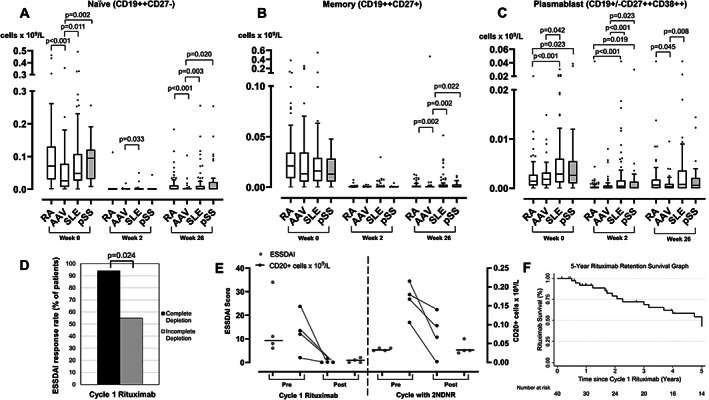
Figure 3.

Comparison of peripheral B‐cell subsets across four diseases and associations with response. B‐cell subsets including naïve (A), memory (B), and plasmablast (C) were compared between patients with RA, AAV, SLE, and pSS at rituximab initiation, 2 weeks and 26 weeks post‐rituximab. The box plots denote median, and the error bars represent Tukeys. Analyses were performed using Kruskal‐Wallis followed by multiple non‐parametric testing with Dunn's correction. (D) The bar chart represents the proportion of patients with ESSSDAI response based on complete B‐cell depletion status. (E) The ESSDAI score (left Y‐axis and in grey dots) and CD20+ B cells (right Y‐axis and in black dots) are plotted for all four patients with 2NDNR to rituximab. The black horizontal line in the ESDDAI figure represents the median. (F) Kaplan‐Meier survival graph of rituximab retention at 5 years. The vertical markings on the graph denote censored cases. 2NDNR, secondary non‐depletion and non‐response; AAV, anti‐neutrophil cytoplasmic antibody‐associated vasculitis; ESSDAI, EULAR Sjögren syndrome disease activity; pSS, primary Sjögren syndrome; RA, rheumatoid arthritis; SLE, systemic lupus erythematosus.
