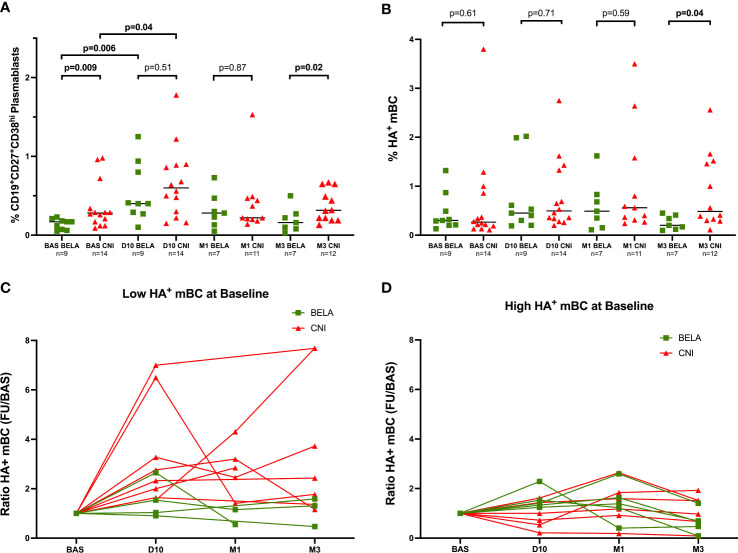
Figure 3.
Kinetics of circulating Plasmablasts and Influenza-specific B-cell subsets prior and after Influenza immunization. Figure 3A Proportion of CD19+CD27+CD38hi plasmablasts. Figure 3B . Proportion of CD19+CD27+HA+ mBc. Figure 3C . Analysis of HA+mBC expansion after immunization in patients with High preformed HA+mBc at baseline. Figure 3D . Analysis of HA+mBC expansion after immunization in patients with Low preformed HA+mBc at baseline. The proportions of CD19+CD27+CD38hi cells (Figure 2A) and CD19+CD27+H1N1+ cells (Figure 2B) are expressed as a percentage in total lymphocytes in both Figures 3A, 3B . The ratio of H1N1+CD19+CD27+ mBC at D10, M1 and M3 after immunization (Figures 3C, 3D) = % H1N1+CD19+CD27+ mBC during follow-up/% H1N1+CD19+CD27+ mBC at baseline. Comparison of proportions between the two groups at each time point were analyzed using a Mann-Whitney Test.

