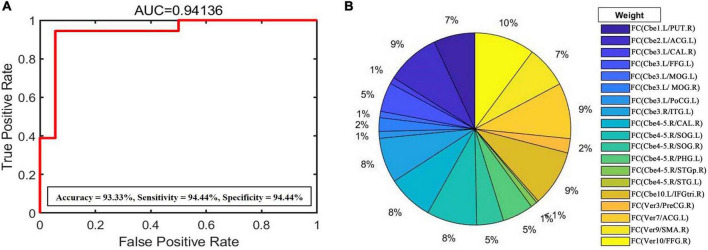
FIGURE 3.
(A) Support vector machine (SVM) weight analysis was performed according to the predicted results to evaluate the impact of FC changes of each cerebellar subregion following CTSCI. The AUC value, accuracy, sensitivity, and specificity of this binary classification were 0.94, 93.33, 94.44, and 94.44%, respectively. (B) SVM weight analysis showed that the FC values between the vermis_10 and right fusiform gyrus had the greatest weight in the functional changes of CTSCI. FC, functional connectivity; CTSCI, complete thoracolumbar spinal cord injury; AUC, area under the curve; Cbe, cerebellum; Ver, vermis; PUT, Putamen; ACG, anterior cingulate gyrus; CAL, calcarine; FFG, fusiform; MOG, middle occipital gyrus; PoCG, postcentral gyrus; ITG, inferior temporal gyrus; SOG, supra-occipital gyrus; PHG, parahippocampal gyrus; STGp, superior temporal pole; STG, superior temporal gyrus; IFGtri, trigonometric inferior frontal gyrus; PreCG, precentral gyrus; SMA, supplementary motor area; R, right; L, left.

