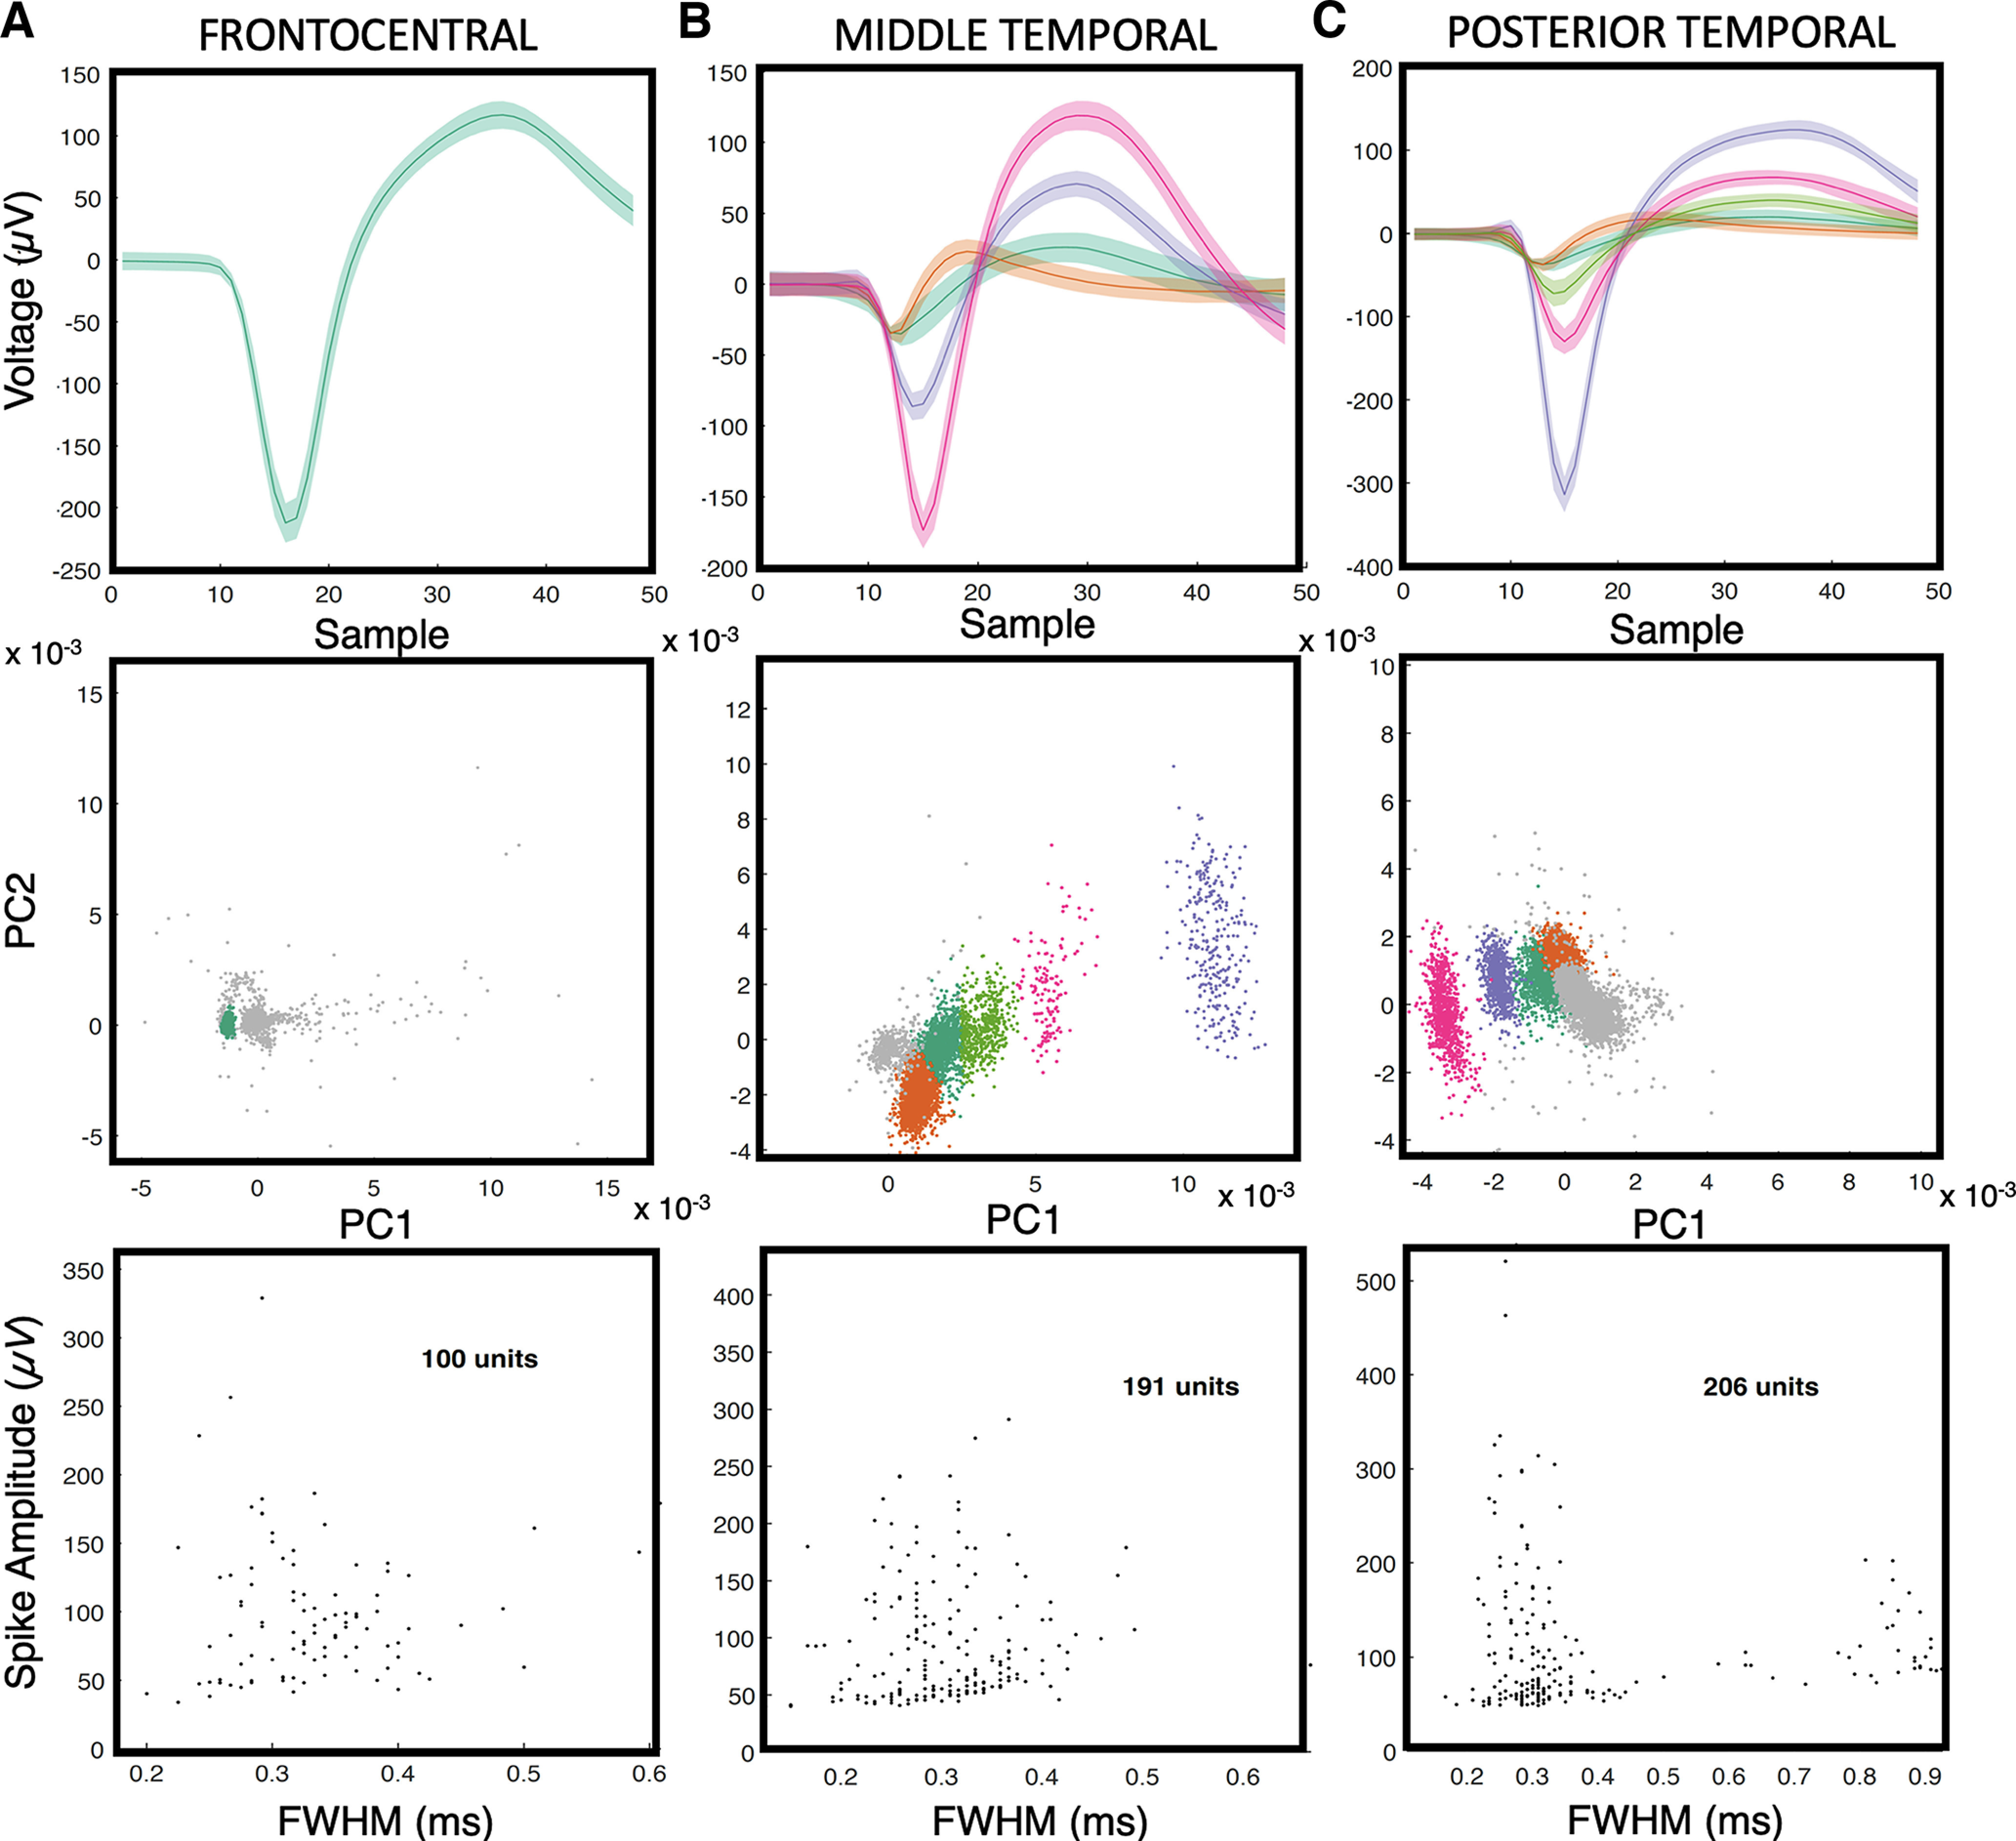
Figure 2.

Single units from microelectrode arrays. A–C, Each subject had an MEA placed in the frontocentral cortex (A; subject A), middle temporal cortex (B; subject B), or posterior temporal cortex (C; subject C), respectively. The top row shows the mean and SD of all spike waveforms in an example channel. The middle row shows clusters of the corresponding spike waveforms and their separation from a noise cluster in principal component (PC) space. The bottom row contains scatter plots of the full-width at half-maximum (FWHM) of the spike waveform widths versus amplitudes for all units.
