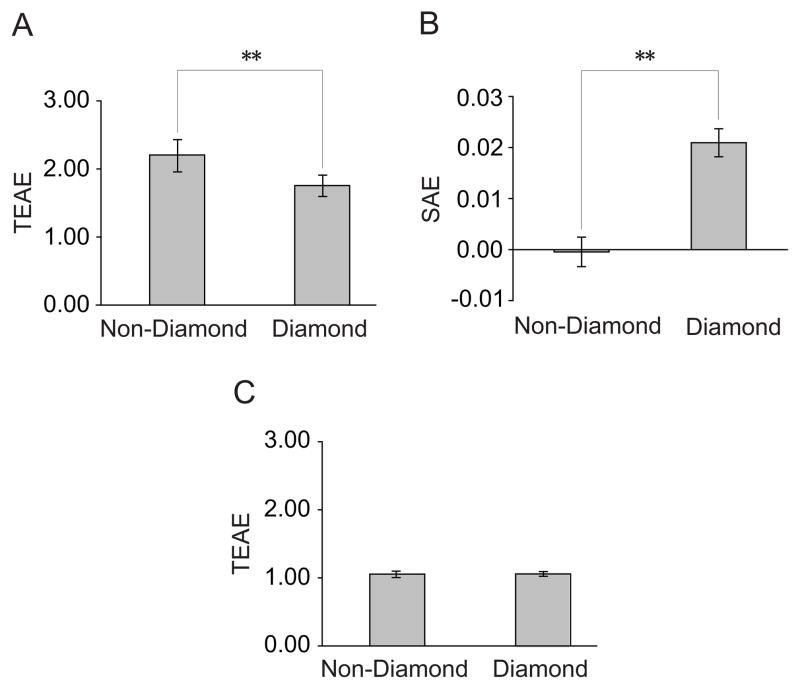
Figure 3.
Results of Experiment 2. (A) TEAE magnitudes from adapting to the diamond and the non-diamond stimuli when the adapted and test orientations were identical. (B) SAE magnitudes from adapting to the diamond and the non-diamond stimuli. (C) TEAE magnitudes from adapting to the diamond and the non-diamond stimuli when the test orientation was orthogonal to the adapted orientation. Asterisks indicate a statistically significant difference between two stimulus conditions (*p<0.05; **p<0.01). Error bars denote 1 SEM calculated across subjects for each condition.

