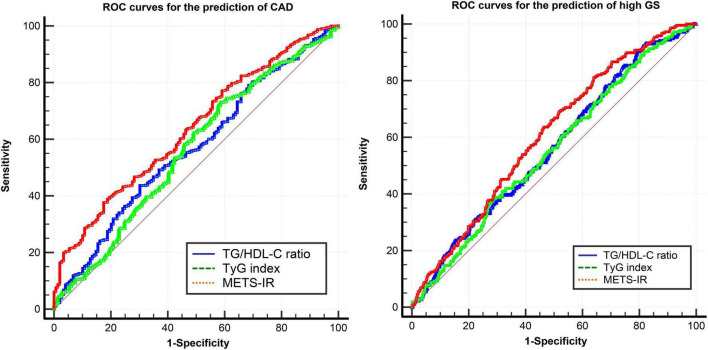
FIGURE 4.
ROC curves of the TG/HDL-C ratio, TyG index, and METS-IR for the prediction of CAD and high GS. ROC curves, receiver operator characteristic curves; CAD, coronary heart disease; GS, Gensini score; TG/HDL-C ratio, the ratio of triglycerides to high-density lipoprotein cholesterol; TyG index, triglyceride and glucose index; METS-IR, metabolic score for insulin resistance.

