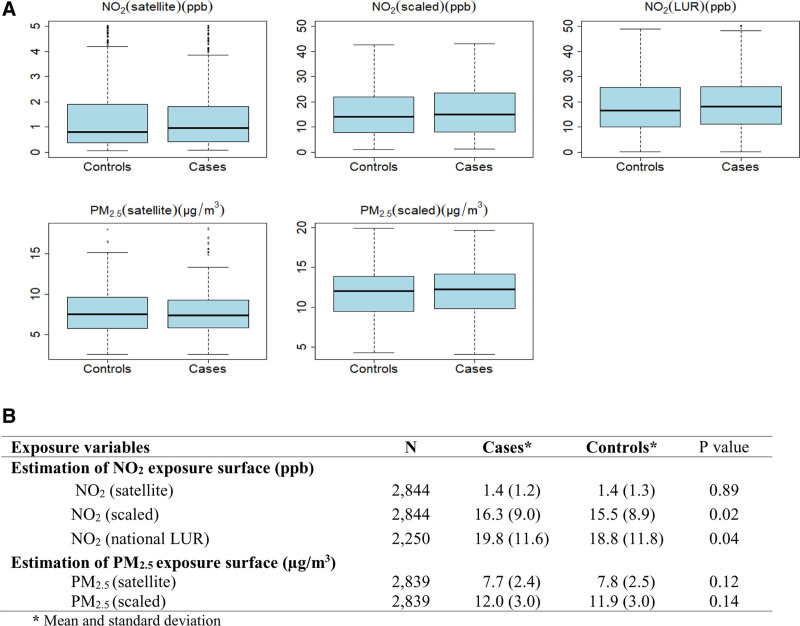
Figure 1.
Comparison of air pollution concentrations between case and control series. Box plots comparing cases and controls data of air pollutant concentrations (A). Values shown are median (line within box), 25th and 75th percentiles (bottom and top of box, respectively). B, Air pollutant concentrations comparison data between cases and controls. NECSS, 1975–1994.

