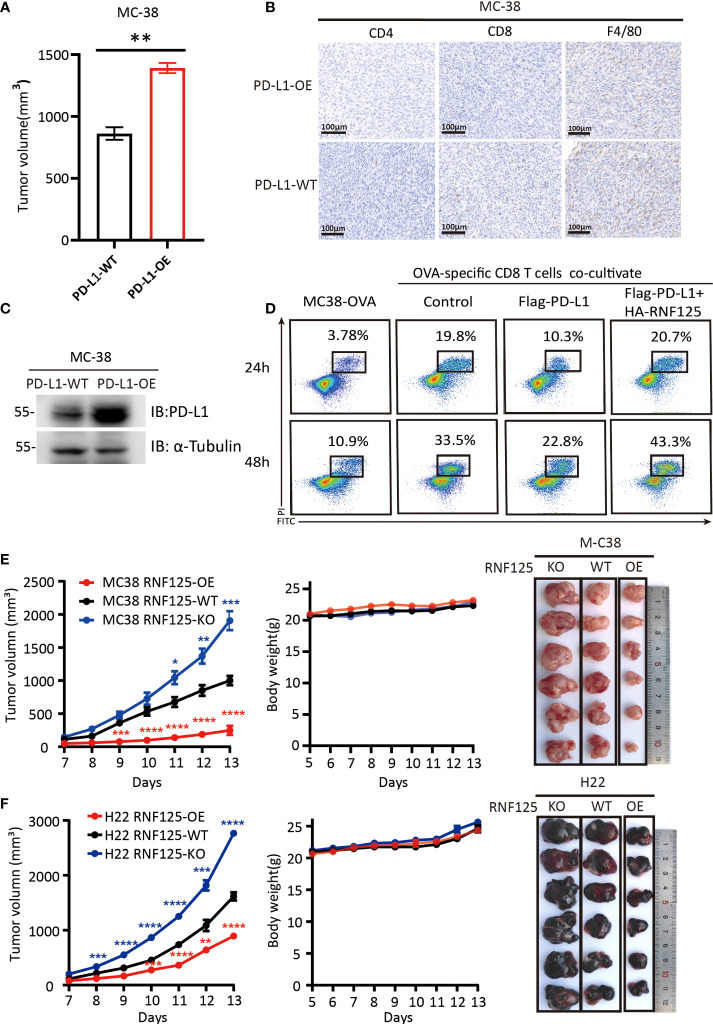
Figure 3.
RNF125 inhibits tumor growth and promotes tumor immunity (A–C) Correlation analysis between PD-L1 protein level and immune infiltration (A) The volume of tumors were compared between MC-38 tumor with PD-L1 overexpression (PD-L1-OE) and it’s parental tumor (PD-L1-WT) (n=3), (B) PD-L1 immune infiltration level of these two tumors were analyzed by IHC using anti-CD4, anti-CD8 and anti-F4/80 antibodies. (C) PD-L1 protein level of these two tumors were analyzed by WB using anti-PD-L1 and anti-α-tubulin. (D) Representative images of FACS analysis of OVA-specific CD8 T cell-mediated elimination of MC-38-OVA cells, as determined by annexin V-FITC and propidium iodide (PI) double labeling. (E, F) Tumor volume, body weight and representative images of the syngeneic tumors derived from MC-38 (E) or H22 (F) RNF125-KO, RNF125-WT and RNF125-OE cell line syngeneic mouse models. (n=6). (* indicates P <0.05, ** indicates P <0.01, and *** indicates P <0.001, **** indicates P <0.0001).

