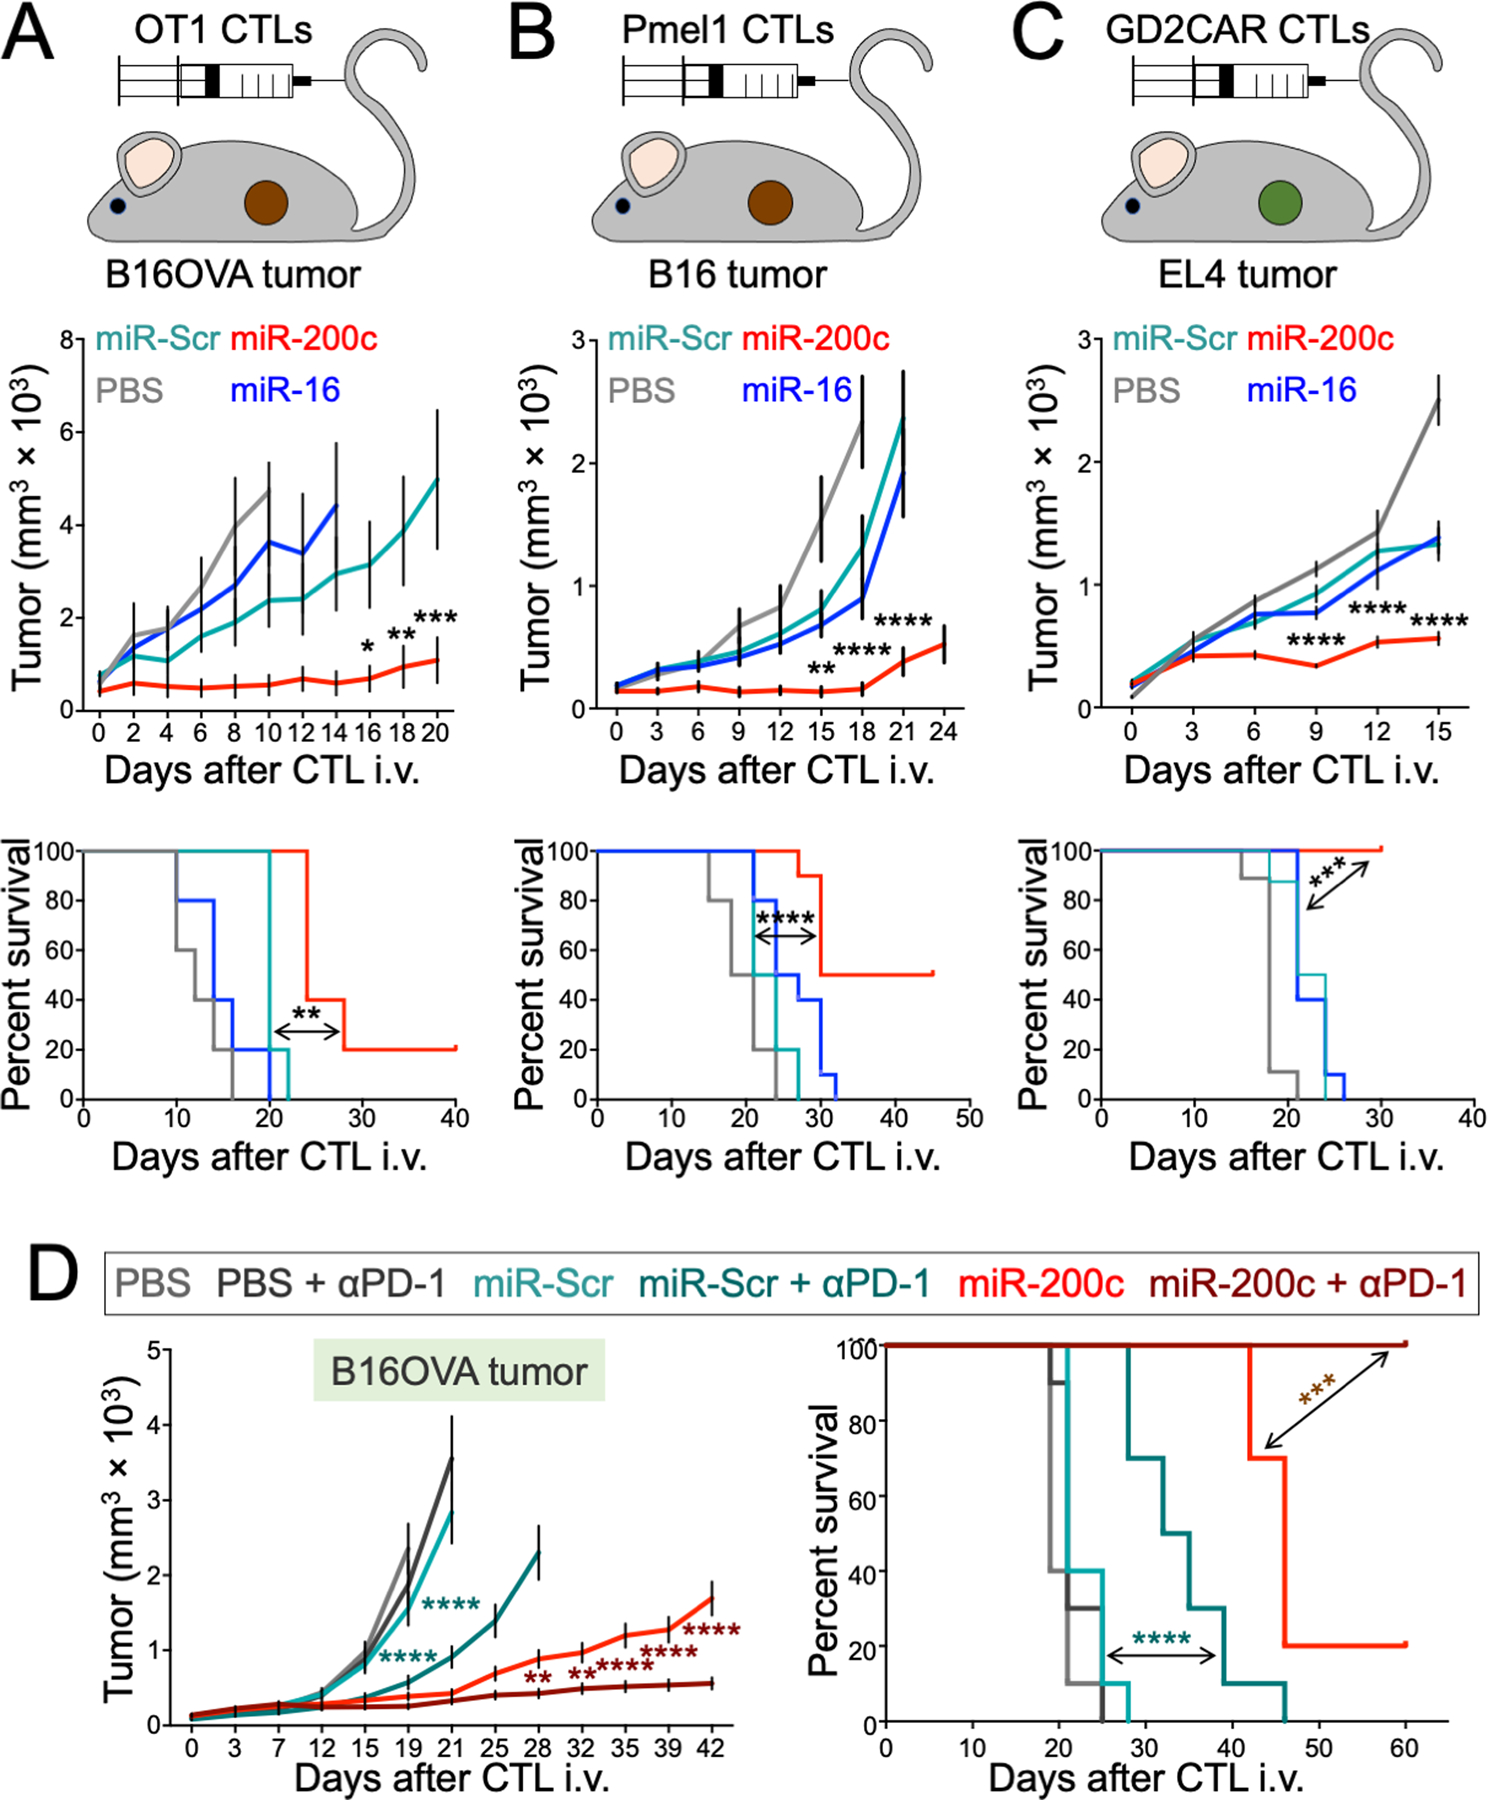
Figure 2. miR-200c enhances CTL persistence and anti-tumor function in vivo.

(A to C) Mice bearing subcutaneous (s.c.) B16OVA (A), B16 (B), or EL4 (C) tumors received transfers of OT1 (A) or Pmel1 (B) CTLs expressing the indicated miRs or OT1 CTLs expressing the indicated miRs together with GD2CAR (C). An additional group received vehicle control (PBS). Above, schematic diagrams of each model are shown. Middle, mean tumor volume is plotted against time. Below, Kaplan-Meier plots show overall survival. n = 5 per group for (A), n = 10 per group for (B) and (C). (D) Mice bearing s.c. B16OVA tumors received adoptive transfer of OT1 CTLs expressing the indicated miRs and treated with either anti-PD-1 antibody (αPD-1) or isotype control. Mean tumor volume is plotted on the left, with survival on the right. n = 10 per group. All error bars denote SEM. *P ≤ 0.05, **P ≤ 0.01, ***P ≤ 0.001, and ****P ≤ 0.0001, calculated by two-way ANOVA for tumor growth curves and Log-rank test for survival plots. In (A to C), significance calculations compared the miR-200c and miR-Scr groups, whereas in (D), significance calculation compared the miR-200c + αPD-1 and miR-200c groups (maroon asterisks) or the miR-Scr + αPD-1 and miR-Scr groups (aqua asterisks). All data are representative of at least 2 independent experiments.
