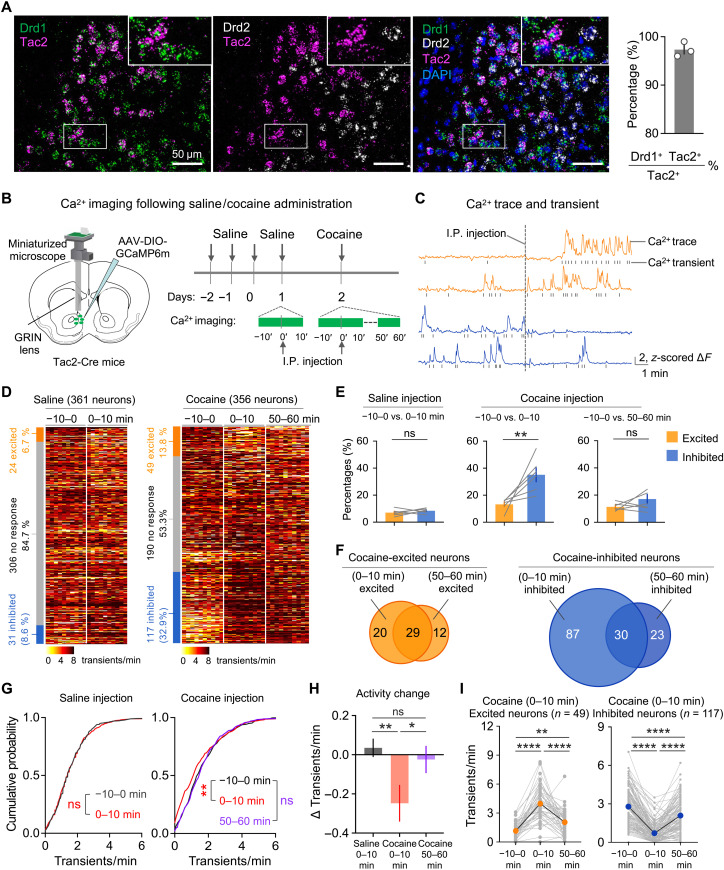
Fig. 1. Tac2-expressing D1 MSNs in NAc respond to cocaine administration.
(A) RNA FISH of Drd1, Drd2, and Tac2. High-magnification images of the boxed areas are on the top right. The Drd1+ Tac2+ double-positive cells account for 97.3 ± 1.5% of Tac2+ neurons (n = 3 mice; total, 548 cells; scale bars, 50 μm). (B) Diagram of calcium imaging following saline/cocaine administration. The recorded sessions including the preinjection phase (−10 to 0 min), postinjection initial phase (0 to 10 min), and decay phase (50 to 60 min) are indicated with green lines. (C) Representative calcium traces and transients of individual neurons that were activated (orange) or inhibited (blue) by cocaine injection. I.P., intraperitoneal. (D) Heatmap of calcium transient frequency of all neurons from six mice recorded following saline (left) or cocaine (right) injection. The percentage of neurons that were excited by (orange), inhibited by (blue), or had no response to (gray) treatment were shown in the stacked bar graph next to the heatmap. (E) Bar graphs showing the percentages of neurons that are excited (orange) or inhibited (blue) by saline (left) or cocaine (right) administration. (F) Venn diagram showing the overlap between the initial phase (0 to 10 min) and decay phase (50 to 60 min) of postinjection of cocaine-excited neurons (left) or cocaine-inhibited neurons (right). (G) Cumulative distribution of calcium transient frequencies around saline (left) and cocaine (right) injection (saline, n = 361; cocaine, n = 356). (H) Bar graph showing the calcium activity change before and after injection. (I) Average calcium transient frequency before and after cocaine injection from neurons that showed elevated (left, orange) or reduced (right, blue) activity during the initial phase (0 to 10 min) of cocaine injection. Data in (A), (E), (H), and (I) are presented as means ± SEM. The P values are calculated on the basis of statistical tests in table S1. *P ≤ 0.05; **P ≤ 0.01; ****P ≤ 0.0001; not significant (ns), P > 0.05.

