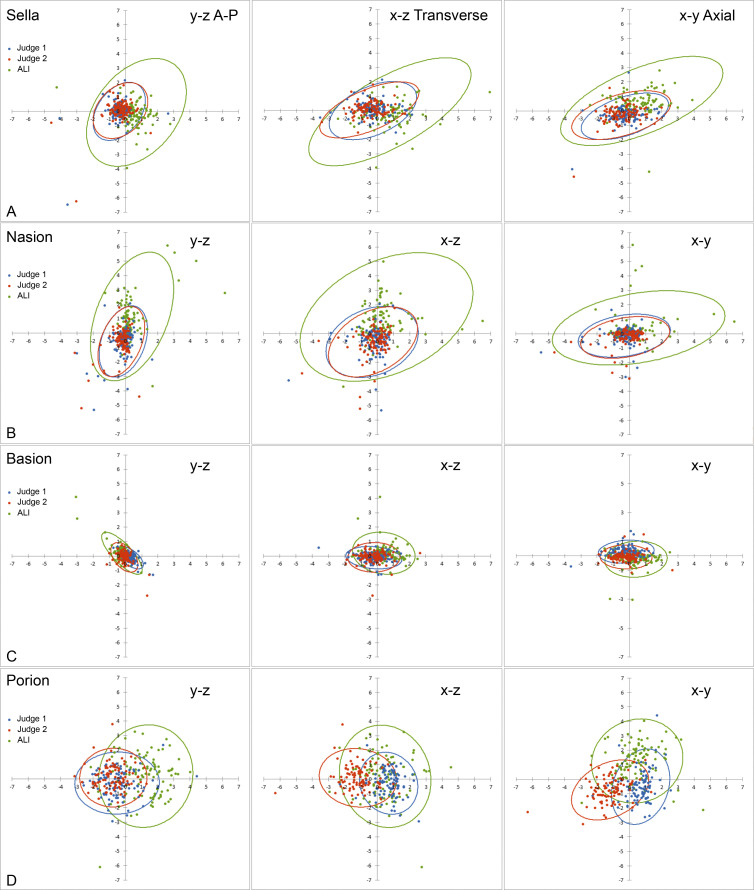
Figure 3.
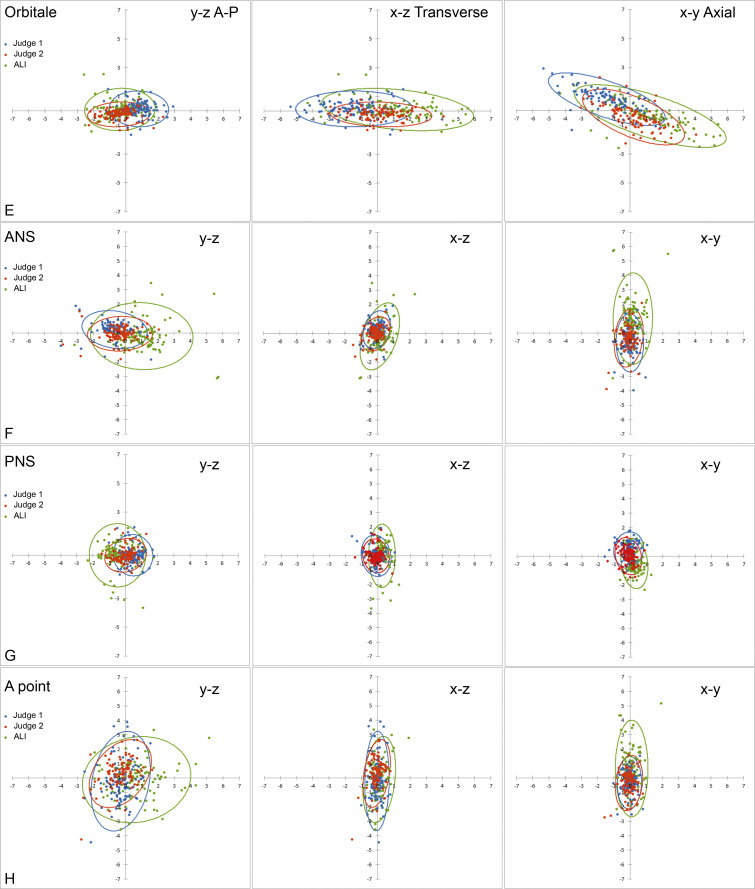
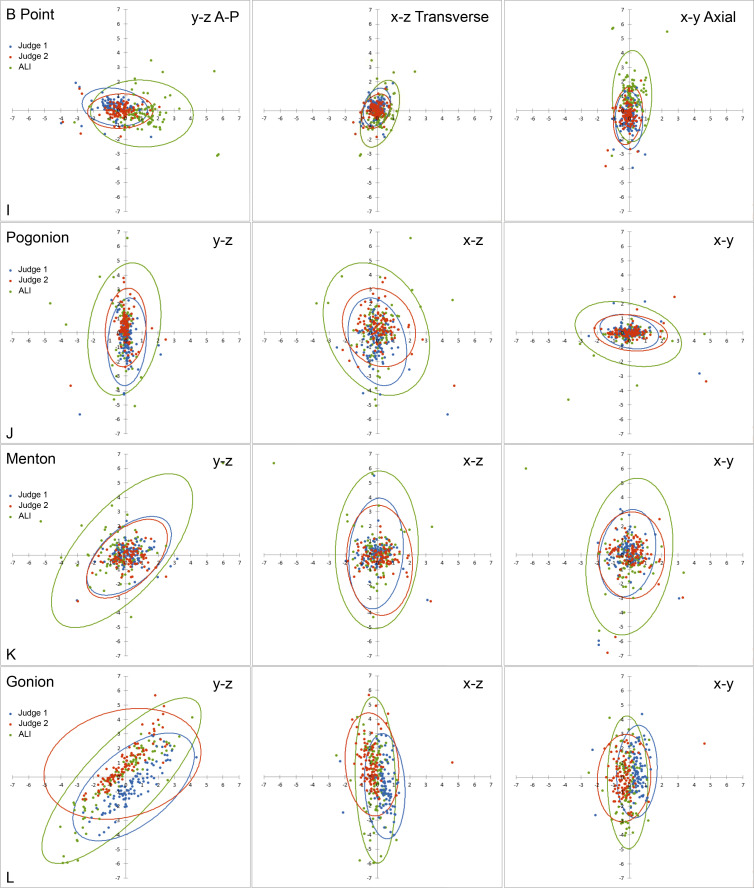
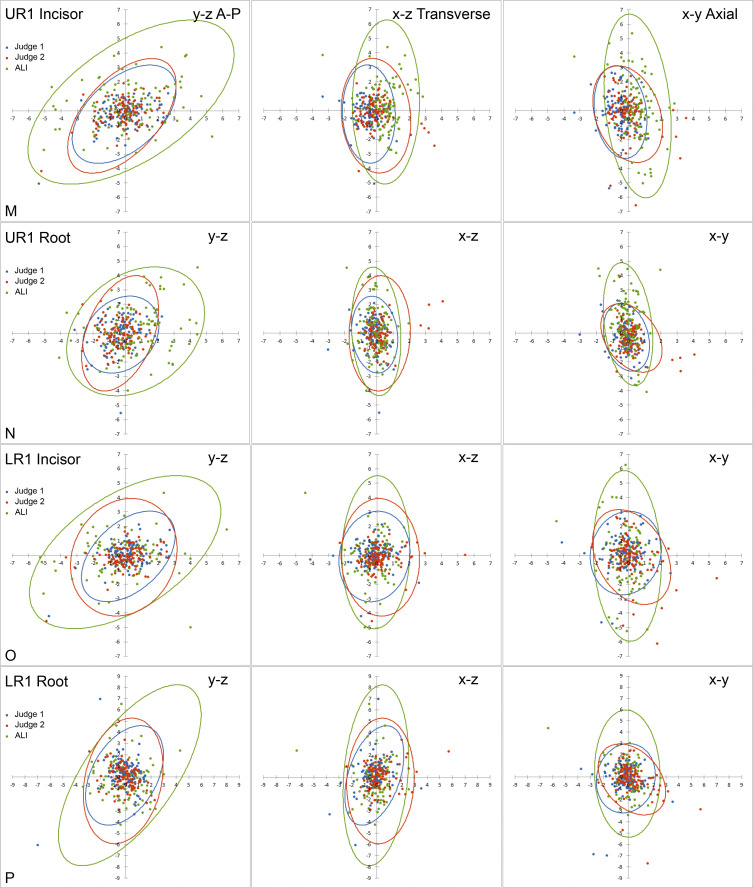
Scatterplots with 95% confidence ellipses depicting the envelope of error in different planes of view. Judge 1 is depicted in blue, Judge 2 is depicted in red, and ALI is depicted in green. For bilateral landmarks, the right-side landmark is presented. (A) Sella. (B) Nasion. (C) Basion. (D) Porion. (E) Orbitale. (F) ANS. (G) PNS. (H) A-Point. (I) B-Point. (J) Pogonion. (K) Menton. (L) Gonion. (M) UR1 Incisor Edge. (N) UR1 Root Apex. (O) LR1 Incisal Edge. (P) LR1 Root Apex.
Figure 3.
Continued.
Figure 3.
Continued.
Figure 3.
Continued.


