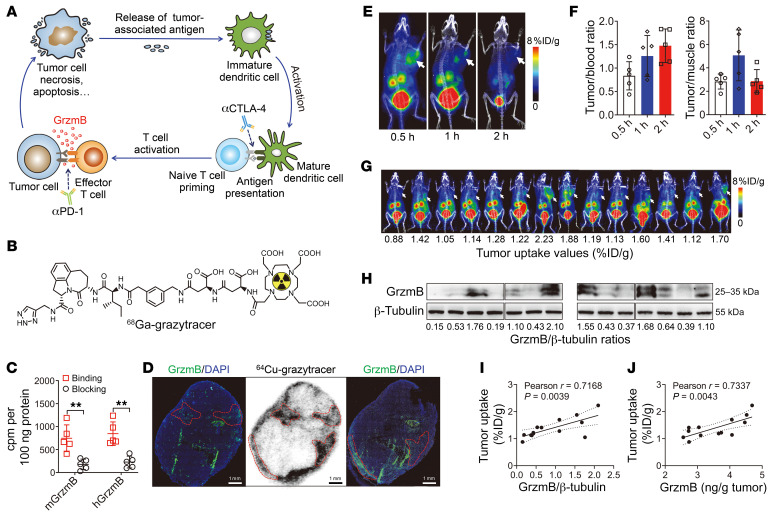
Figure 2. In vitro and in vivo characterization of 68Ga-grazytracer.
(A) Schematic of effector T cell activation and granzyme B (GrzmB) secretion following immunotherapy. (B) Chemical structure of 68Ga-grazytracer. (C) Binding specificity of 68Ga-grazytracer with murine (m) or human (h) granzyme B (n = 5). (D) Autoradiography (middle) and granzyme B immunofluorescence staining (2 slides) of tumor serial sections (15 μm thick) harvested from MC38 tumor–bearing mice at 0.5 hours after 64Cu-grazytracer injection. The overlay regions in these 3 serial sections are indicated by dotted red lines. Scale bars: 1 mm. Data are representative of 3 independent experiments. (E) Representative PET images of 68Ga-grazytracer in anti–PD-1–treated mice at 0.5, 1, and 2 hours after injection. (F) Calculated tumor-to-blood and tumor-to-muscle ratios of 68Ga-grazytracer (n = 5). (G) Small-animal PET images of 68Ga-grazytracer and corresponding tumor uptake values in MC38 tumor–bearing mice (16 mice were subjected to PET imaging, and 2 were excluded due to failed tail vein injection). (H) Western blotting of granzyme B in MC38 tumors harvested from MC38 tumor–bearing mice (from G). The lanes were run on the same gel but were noncontiguous. (See supplemental material for full, uncut gels.) (I) Correlation between the tumor uptake of 68Ga-grazytracer quantified by PET imaging and granzyme B/β-tubulin ratios determined by ex vivo Western blotting (r = 0.7168 by Pearson’s correlation analysis). (J) Correlation between the tumor uptake of 68Ga-grazytracer quantified by PET imaging and ex vivo granzyme B levels determined by ELISA (r = 0.7337 by Pearson’s correlation analysis). Tumors are indicated by white arrows in PET images. All numerical data are presented as mean ± SD. **P < 0.01 by unpaired Student’s t test (C).

