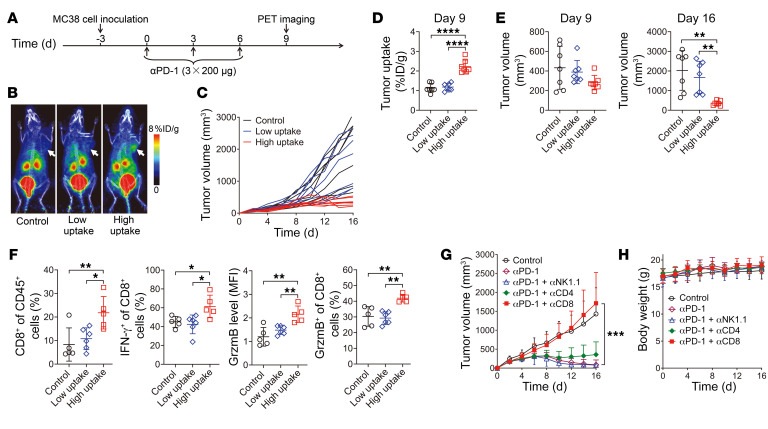
Figure 3. Small-animal PET imaging of 68Ga-grazytracer to predict tumor responses to anti–PD-1 therapy in MC38 tumor–bearing mice.
(A) Timeline of anti–PD-1 (αPD-1) therapy and PET imaging in MC38 tumor–bearing mice. (B) Representative PET images of 68Ga-grazytracer at 0.5 hours after injection in MC38 tumor–bearing mice treated with PBS (control) or anti–PD-1 with high and low tumor uptake (cutoff of 1.45 %ID/g). Tumors are indicated by white arrows. (C) Individual tumor volumes of MC38 tumor–bearing mice in the control group and treatment groups with high and low tumor uptake. (D) Quantified tumor uptake of 68Ga-grazytracer at 0.5 hours after injection on day 9 in each group of MC38 tumor–bearing mice (n = 7/group). (E) Tumor volumes of MC38 tumor–bearing mice on days 9 and 16 (n = 7/group). (F) Flow cytometric analysis showing the proportion of CD8+ T cells in CD45+ cells, IFN-γ+ or granzyme B+ in CD8+ T cells, and the granzyme B levels in tumors harvested from mice after the indicated treatments (n = 5–6/group). (G and H) Tumor growth curves and body weight of MC38 tumor–bearing mice after the indicated treatments (n = 6–8/group). All numerical data are presented as mean ± SD. *P < 0.05, **P < 0.01, ***P < 0.001, ****P < 0.0001 by 1-way ANOVA with a post hoc Tukey’s test (D–F) and 2-way ANOVA (G).

