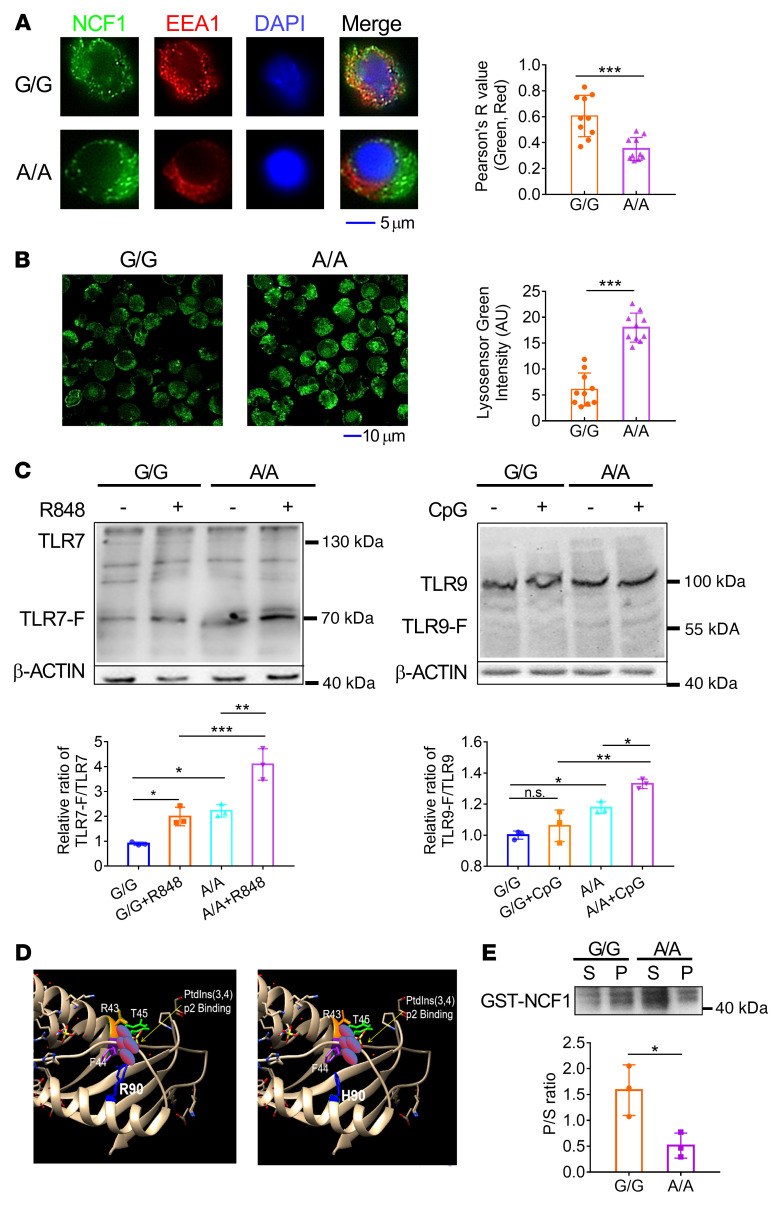
Figure 2. NCF1 p.R90H impairs endosomal localization of NCF1 and acidifies the endosomal pH.
pDCs were stimulated with CpG for 2 hours. (A) Colocalization of NCF1 (green) and EEA1 (red) was detected by confocal microscopy and analyzed by ImageJ. Scale bar: 5 μm. One data point in the plot indicates the mean of Pearson’s R values from 5 cells, and a total of 50 cells per group were calculated . (B) The pH of late endosomes/lysosomes in CpG-activated pDCs was indicated by a lysosome sensor, detected by confocal microscopy, and measured by ImageJ. Scale bar: 10 μm. One data point in the plot indicates the average MFI of 5 cells, and a total of 50 cells per group were calculated. (C) Immunoblot analysis of cleavage of TLR7 and TLR9. G/G and A/A pDCs were stimulated with R848 or 5 μM CpG for 1 hour, respectively. The levels of intact TLR7 and the cleaved TLR7 fragment (TLR7-F) in R848-treated groups and the levels of intact TLR9 and the cleaved TLR9 fragment (TLR9-F) in the CpG-treated groups were analyzed. The ratios of cleaved TLR to intact TLR were calculated. (D) Structure of the PX domain of NCF1 90R and 90H. R90 and R43 are amino acids responsible for PtdIns(3,4)p2 binding. (E) Immunoblot analysis of GST-NCF1. S, protein in supernatant, P, protein in precipitation. The P/S ratios were calculated. Experiments were repeated 3 times. Error bars represent the SEM. *P < 0.05, **P < 0.01, and ***P < 0.001, by 2-tailed, unpaired t test (A, B, and E) or 1-way ANOVA with Tukey’s multiple-comparison test (C).

