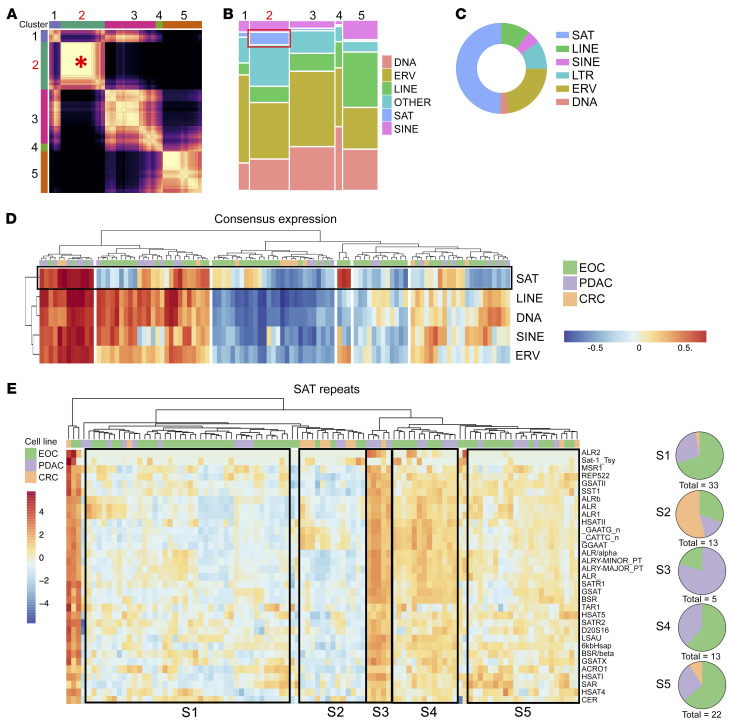
Figure 2. Repeat RNAs are coregulated in discrete clusters, with satellite repeat RNAs exhibiting unique expression patterns in epithelial cancers.
(A) Heatmap for consensus clustering of repeat elements based on normalized expression. The red asterisk highlights satellite repeat–driven (SAT-driven) cluster 2, which has the strongest consensus correlation of the analyzed clusters. (B) Mosaic plot demonstrating relative repeat element subclass composition of each consensus cluster from A. The red box indicates SAT representation in cluster 2. (C) Proportion of total repeat expression for each subclass within the top 50 variant repeat RNAs across cell lines. (D) Hierarchical clustering of consensus expression of each repeat subclass across EOC (green), PDAC (purple), and CRC (gold) cell lines, depicting SAT consensus expression distinct from consensus expression of other repeat subclasses. (E) Heatmap and hierarchical clustering of EOC (green), PDAC (purple), and CRC (gold) cell lines by SAT RNA expression. Expression is plotted as scaled log2(normalized counts per million). Major clusters defined by similar SAT expression profiles are outlined by black boxes. Pie charts S1–S5 depict the cancer-type composition of each cluster, highlighting clusters distinct from tissue of origin.

