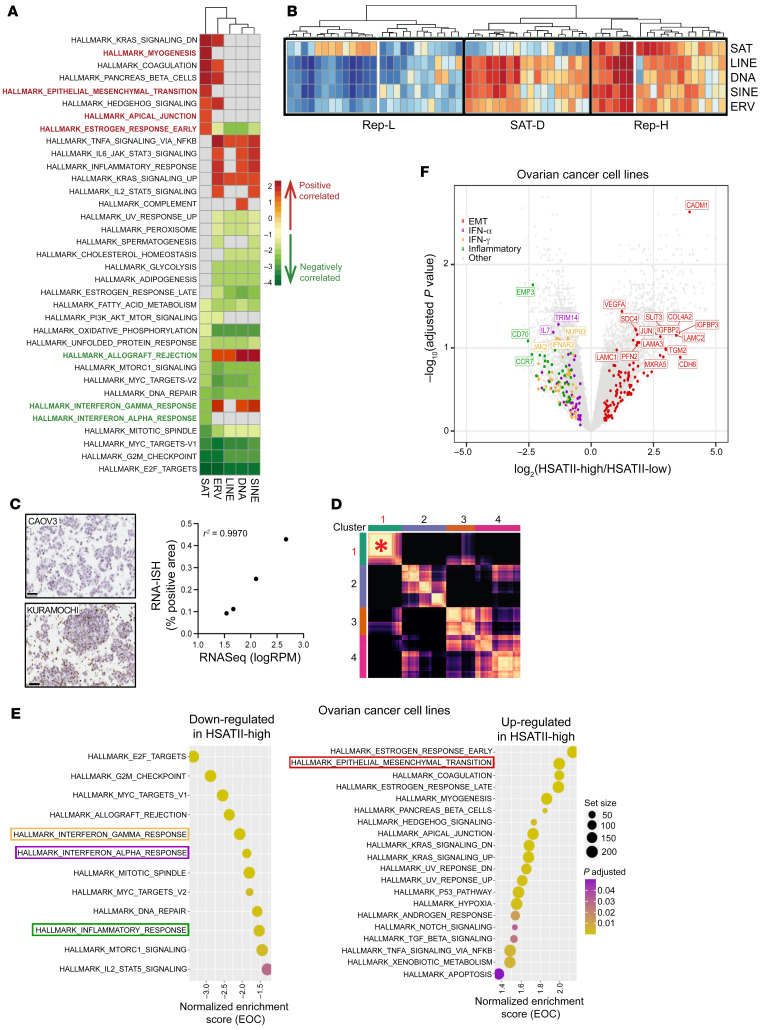
Figure 3. Satellite repeat expression is associated with upregulation of epithelial-mesenchymal transition and downregulation of innate immune-response genes in EOC models.
(A) Heatmap of enriched Gene Ontology terms identified using gene set enrichment analysis (GSEA) plotted based on normalized enrichment score. GSEA was applied to a ranked gene list based on correlation with the consensus expression calculated for each repeat subclass, with the FDR set at 0.05. Positive enrichment scores (red) indicate functions that positively correlate with repeat subclass expression. Negative enrichment scores (green) indicate functions that negatively correlate with repeat expression. (B) Hierarchical clustering of consensus expression calculated for each repeat subclass in EOC cell lines. Major clusters are outlined by black boxes. (C) Representative RNA-ISH images with HSATII-specific probes in 2 EOC cell lines and correlation (Pearson’s r2) between HSATII RNA expression as determined with RNA-Seq by log(reads per million[RPM]) (as determined with RNA-Seq, with log(reads per million) as units) and percentage of tumor cells with a positive staining for HSATII by RNA-ISH. Original magnification, ×40 (D) Heatmap for consensus clustering of all repeat elements except HSATII, which was removed from analysis, based on normalized expression. The asterisk highlights SAT-driven cluster 1, which shows the highest consensus correlation of analyzed clusters, similar to clustering when HSATII was included. (E) GSEA of hallmark terms ranked on the basis log2FC of coding genes for pathways containing genes that are upregulated and downregulated in HSATII-high compared with HSATII-low ovarian cancer cell lines, based on highest (Q4) and lowest (Q1) quantile (see Supplemental Figure 3C). Colored boxes represent the pathways indicated in F. Circle size represents gene set size, and circle color represents adjusted P value. (F) Volcano plot depicting differentially expressed coding genes between HSATII-high and HSATII-low EOC cell lines. EMT, IFN-α, IFN-γ, and inflammatory hallmark pathways are highlighted.

