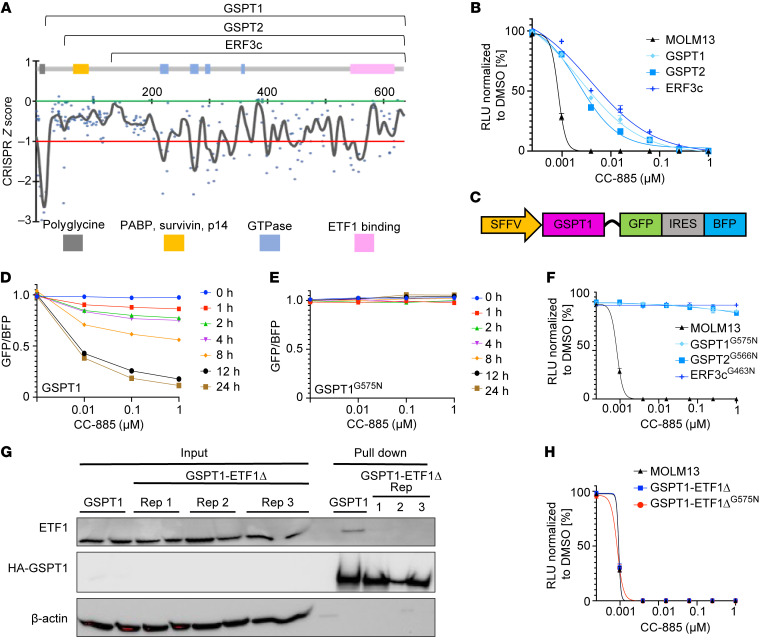
Figure 1. The interaction of GSPT1 with ETF1 is critical for leukemia cell survival.
(A) Combined CRISPR scores in MOLM13 cells comparing sgRNA representation from triplicates at day 22 versus day 0. Gray, GC-rich (92%) polyglycine repeat; yellow, region containing regions reported to interact with survivin, p14, and poly(A)-binding protein (PABP) involved in nonsense-mediated decay; blue, GTPase domains; pink, ETF1 binding region. Numbers on the x axis represent amino acid position. The y axis represents CRISPR z score and is defined by the median change (day 22 v day 0) in the representation of the negative control sgRNAs (green line = 0.0) and the median change (day 22 v day 0) in the representation of the positive control sgRNAs (red line = –1.0). (B) Cell viability of MOLM13 cells expressing GSPT1, GSPT2, and ERF3c constructs. Cell viability was assessed using CellTiter-Glo luminescent assay. (C) Design of GSPT1 degradation reporter. (D and E) Comparison of degradation of GSPT1 (D) and GSPT1G575N (E). GFP/BFP ratio is relative to DMSO. Representative data of 3 biological replicates. Mean ± SEM of 3 technical replicates. (F) Cell viability of MOLM13 cells expressing drug-resistant GSPT1G575N, GSPT2G566N, and ERF3cG463N constructs. Cell viability was assessed using CellTiter-Glo luminescent assay. (G) Immunoprecipitation of HA-GSPT1 and HA-GSPT1 ETF1 binding mutant (ETF1Δ) with mutations in GSPT1 at S541A, I542A, Y547A, F583A, and D618A. (H) Cell viability in MOLM13 cells expressing GSPT1-ETF1Δ (drug sensitive and drug resistant; G575N). For all CellTiter-Glo luminescent assays, cell viability was assessed 72 hours after treatment with CC-885 (graphs represent combined data from 3 biological replicates performed in technical triplicate; symbols represent mean ± SEM).

