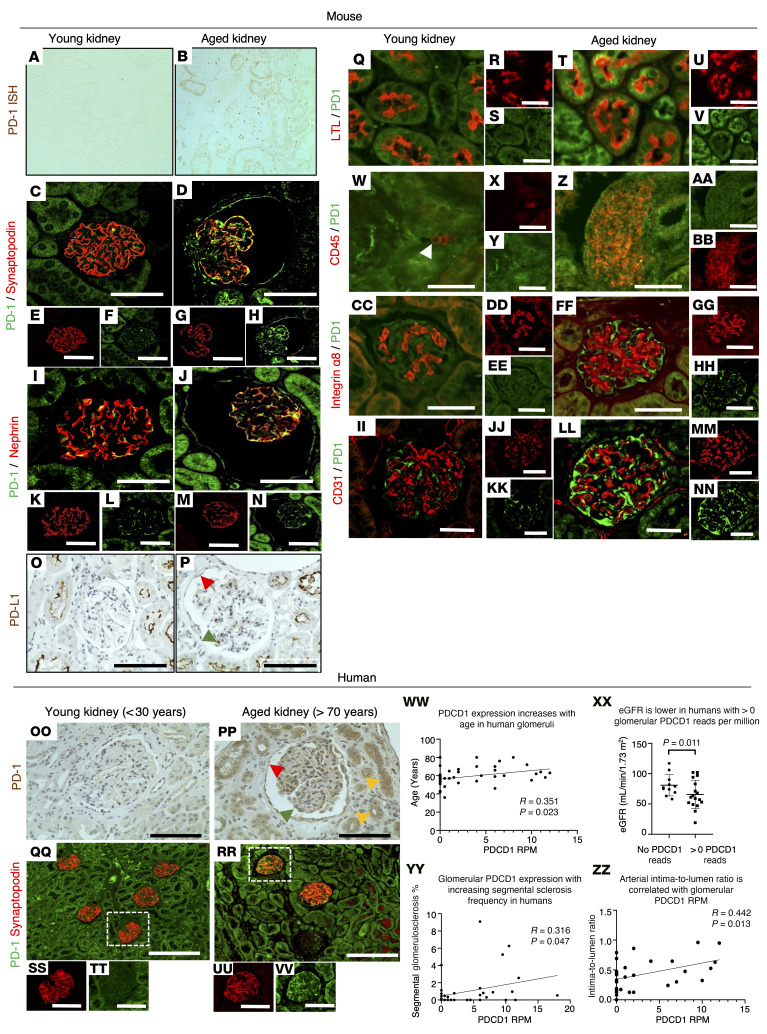
Figure 1. Podocyte PD-1 immunostaining and transcripts.
(A–NN) Mouse kidney. (A and B) In situ hybridization shows that compared with young kidney (A), PD-1 transcript (brown) increases in aged kidney (B). (C–H) PD-1 (green) and synaptopodin (red) staining shows that PD-1 in mouse glomerulus (C) merges with synaptopodin-positive podocytes in aged kidney (D, yellow). PD-1 stains PECs along Bowman’s capsule (D, green). (E–H) Fluorescence channels from C and D. (I–N) PD-1 (green) and nephrin (red) staining in young glomeruli (I) merges with nephrin in aged kidney (J, yellow). PD-1 increased in PECs and proximal tubular epithelial cells (J, green). (K–N) Single channels from I and J. (O and P) PD-L1 (brown) in young mouse kidney (O) is detected in a podocyte (green arrowhead), PECs (red arrowhead), and proximal tubules in the aged mouse (P). (Q–V) Lotus tetragonolobus lectin (LTL) (red) stains proximal epithelial cells and merges with PD-1 (green) in aged kidney (T). (W–BB) CD45+ interstitial lymphocytes (red) merge with PD-1 (green) in aged kidney. (CC–HH) PD-1 (green) does not merge with the mesangial cell marker α8 integrin (red). (II–NN) PD-1 (green) does not merge with the endothelial cell marker CD31 (red). (OO–VV) Human kidney. (OO and PP) PD-1 (brown) in young human kidney (OO) increases in podocytes (green arrowhead), PECs (red arrowhead), and tubular epithelial cells (orange arrowheads) in aged human kidney (PP). (QQ–VV) PD-1 (green) and synaptopodin (red) in young human glomerulus merges with synaptopodin (yellow) in aged human glomerulus. (WW–ZZ) PDCD1 transcripts from microdissected human glomeruli. Expression of PDCD1 (corresponding to human PD-1) increased with age (WW), accompanied by lower eGFR (XX), higher glomerulosclerosis (YY), and vascular injury (ZZ). Scale bars: 25 μm (C–NN), 100 μm (OO, PP, and SS–VV), and 200 μm (QQ and RR). Statistical analysis was performed by t test, χ2 test, and quasi-Poisson regression modeling.

